
Europe
going solar
| |
|
||||||
|
Europe
going solar |
index | ||||||
|
|
|
||||
 |
^^^ Q-Cells is now part of the Korean chemical conglomerate Hanwha, after its shocking insolvency in April 2012 (net loss in 2011: 846 million Euro). ©
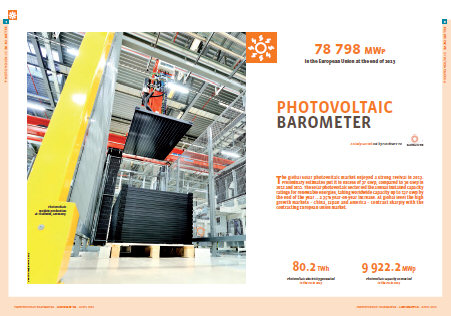
Photovoltaic Barometer – EurObserv'ER April 2014. |
* Note: In this article, the decimal separator used is the "comma". Hence, the English "1.4 million" is written as "1,4 million", and half of a percent ("0.5%") is given as "0,5%".
Some numbers in this report have been changed later in the Barobilan 14 report of the same organisation, published December 2014. In an article, primarily focussing on the contribution of Netherlands in the EU 28 ratings, the changes have been incorporated by Polder PV. You can find this article (in Dutch), with some new graphs, here.
Summary/Samenvatting
On this webpage I present graphs that I made from the data published by
EurObserv'ER in their last Photovoltaic Barometer report (April 2014),
and previous versions. According to these figures, EU28 market in 2013
grew with only 9,9 GWp to an accumulated photovoltaic installation capacity
of 78,8 GWp. This has been a long foreseen, but dramatic reduction from
the 16,7 GWp added in 2012 (that still was dominated by the 7,6 GW and
3,4 GW additions in Germany and Italy). In 2013, with the mentioned end-of-year
volume, over 80 terawatthours of clean electricity might have been produced
(the newly added PV-volume in that year has, of course, only produced
since its date of grid-connection).
Op deze pagina presenteer ik grafieken die ik heb gemaakt van data gepubliceerd door EurObserv'ER in respectievelijk hun laatste Photovoltaic Barometer rapport (april 2014) en uit eerder gepubliceerde documenten. Volgens deze data/figuren is de EU28 markt in 2013 gegroeid met slechts 9,9 GWp nieuw PV-vermogen, waarmee een geaccumuleerd volume van 78,8 GWp werd bereikt. Dit al lang voorspelde tegenvallende resultaat moet worden afgezet tegen de 16,7 GWp in tipjaar 2012 (toen nog gedomineerd door de 7,6 GW resp. 3,4 GW toevoegingen in voormalige wereldkampioenen Duitsland en Italië). In 2013 zou met genoemd eindejaars-volume meer dan 80 terawattuur kunnen zijn opgewekt (waarvan het nieuw toegevoegde jaarvolume uiteraard slechts een deel van het jaar heeft geproduceerd sinds installatie / netkoppeling).
* 2013 Preliminary results/voorlopige resultaten. With respect to the preceding years, the last available data from previous reports have been taken as "final" results (according to EurObserv'ER statistics, for some countries some minor corrections have been implemented a year after the first publication of those results). EurObserv'ER provides "fast-access" data to be able to track market volume growth as soon as possible. Data may differ with other resources (such as EPIA, IEA), depending in part of the definition of "installed" capacity.
Capacities shown are mostly in DC generator capacity, hence the STC value of the PV-modules in the solar installations. Internationally known as "Wp" ("Wattpeak"). Inverter (AC) capacity is not normally considered here. Hence, for an important market such as Flanders, for which only total MWac capacity is known (data by VREG), this fundamental difference should always be kept in mind. According to EPIA, also Spain and Switzerland (the latter not included here, not in EU28) would give "AC capacity" instead of the mostly indicated DC capacity of the PV generator.
Introduction to this webpage (May 12, 2014)
Data
Nederland
(in Dutch)
Market
development for photovoltaics in EU28 graphs
End
of year capacities EU28
Newly
added volume per country
End
of year accumulated capacity per country
Capacity
per inhabitant per country 2013
Capacity
per km² per country 2013
Evolution
ranking top ten countries incl. Netherlands
YOY
growth percentages capacity per country
Solar
electricity production per country 2011-2013
Errors,
adjustments
Links
Previous reports:
up till 2012, up
till 2010, up till 2009,
up till 2008
Introductie
In april 2014 werd een nieuw overzicht van statistieken over zonnestroom in de EU28 (uitgebreid met Kroatië) gepubliceerd door EurObserv'ER. Polder PV maakte wederom, net als voor vorige rapportages van deze instantie, grafieken van de belangrijkste cijfers voor de marktontwikkeling bij PV. Gezien de internationale context, is, na de volgende paragraaf, de rest van dit artikel geschreven in het Engels.
In de EurObserv'ER rapportages worden de cijfers voor Nederland aangeleverd door ECN Beleidsstudies. Aangezien het zo lang duurt voordat er überhaupt voorlopige cijfers van CBS "los" komen (eerste resultaten voor 2013 pas op zijn vroegst eind mei 2014 verwacht), is dat in het verleden met grove schattingen gepaard gegaan. En ging er wel eens iets mis met de eerste opgaves (zie opmerkingen over het rapport voor 2010). In 2012 is er destijds een eerste schatting gedaan op basis van informatie die Polder PV had aangeleverd (zie beschouwing). Echter, op 23 mei 2013 (vroege ochtend van mijn lezing voor The Solar Future in Eindhoven), en veel later, op 18 november 2013 werd, wederom op basis van nieuwe updates van de leverancierslijst van Polder PV, door het CBS flinke upgrades voor dat reeds lang verstreken jaar gedaan. Er werd in 2 fasen 20 en later nog eens 25 MWp toegevoegd aan de nieuwbouw, die daardoor een voorlopige culminatie kreeg van 220 MWp. De eindejaars-accumulatie voor 2012 werd door CBS pas in november 2013 "vastgesteld" op 365 MWp.
Status
2013
Voor 2013 zijn er nu al wel relatief "actuele" cijfers bekend,
maar (natuurlijk) beslist nog geen definitieve. Deze zijn gezien de bronvermelding
achteraan in het document ditmaal kennelijk van Stichting
Monitoring Zonnestroom verkregen. Die ze niet zelf heeft opgesteld,
maar, gezien de gebruikte getallen, ontleend lijken te hebben aan mijn
eerste "minimum" schatting gedaan
in het Solar Trendrapport 2014. Een eerste schatting die al medio
februari 2014 werd ondersteund door de eerste heftige update van het
PIR deel-dossier in de Klimaatmonitor databank (ruim 665 MWp accumulatie,
waarmee al een groei duidelijk werd voor 2013 van minimaal 300
MWp). Echter, op 10 april 2014 volgde nóg
een forse update, van het totale bestand bij Klimaatmonitor, waarbij
voor "alle adressen" een nieuwe tussenstand van alweer 680,4
MWp werd aangegeven (implicerend een nieuwe minimum jaargroei
van 315 MWp). En er nog steeds deeldossier updates (waaronder het zeer
belangrijke "restant" van de nationale
subsidieregeling uitgevoerd door Agentschap NL), en natuurlijk "in
geen enkel dossier vermelde" PV capaciteit ontbreken. Die laatste
Klimaatmonitor update heeft het kennelijk niet "gehaald" in
de huidige EurObserv'ER versie, want daarin staan deze alweer verouderde
data voor Nederland weergegeven:
Voor Nederland achtereenvolgens (geel gemarkeerd): 360 MW accumulatie netgekoppeld vermogen 2012, idem 5 MW off-grid, totaal 365 MW eindejaars-capaciteit, volgens CBS, update 18 november 2013. Dan de veronderstelde nieuwe data voor 2013: "660 MW" netgekoppeld (feitelijk niet als zodanig benoemd door Klimaatmonitor), "5 MW" off-grid (idem, marktsegment is echter zéér slecht bekend, en er wordt volgens mij maar een slag naar geslagen door diegenen die er cijfers over noemen), totaal "eindejaar 665 MW". Dat laatste is met bovengenoemde april 2014 update alweer achterhaald en (veel) te laag (tenzij er zeer substantiële fouten zitten in de deeldossiers in de Klimaatmonitor databank).
Feitelijk uit deze "accumulatie" gegevens zijn de "nieuwbouw data" afgeleid voor Nederland:
In geel gemarkeerd links van de rode streep data voor 2012, en rechts zeer voorlopige, zeer waarschijnlijk veel te lage cijfers voor nieuwbouw in 2013. Opvallend is dat voor 2012 "219 MW" wordt opgegeven voor netgekoppeld, en niets voor "off-grid". Dat klopt niet. De al sinds 18 nov. 2013 bekende officiële cijfers voor 2012 van CBS zijn: 219 MWp netgekoppeld nieuw (waarvan 4 MW bij energiebedrijven, en 215 MW "overig"), en 1 MWp off-grid (autonoom) nieuw voor 2012 (StatLine tabel), totaal 220 MW nieuw. Dat er ook 1 (volstrekt hypothetische, "rekenkundig getruukte"!) MW "uit gebruik genomen" staat in die CBS tabel (net als voor het eerst in 2011), doet niets af aan bovenstaande. Want die volstrekt theoretische "uit gebruik genomen" capaciteit heeft alleen betekenis voor het eindejaars-volume, niet voor de nieuwbouw in dat jaar...
Voor 2013 wordt 300 MW opgevoerd, en wederom geen "off-grid" systemen. Dat laatste waag ik sowieso te betwijfelen, gezien trends in de markt, maar is te begrijpen omdat dat marktsegment nog steeds een blinde vlek voor iedereen lijkt te zijn. Maar die "300" is sowieso veel te weinig, zoals Klimaatmonitor updates al hebben aangetoond. Voor mij was genoemde "300 MW" al begin dit jaar het absolute "bottom-line" scenario voor 2013, er is veel meer geplaatst. Hoeveel meer kan alleen CBS in eerste instantie gaan aangeven (later mogelijk wederom bijstelling, eind dit jaar verwacht). Polder PV zal tijdens The Solar Future op 27 mei a.s. de bekende "prognosewaaier" voor 2013 laten zien.
Vermeende
stroom productie 2012-2013
Ook
is de op basis van de opgestelde capaciteit (door Stichting Zonnestroom??)
berekende jaarlijkse zonnestroomproductie voor alle landen weergegeven
door EurObserv'ER. En wel met een nieuwe "twist" (data in GWh
weergegeven):
Links de hoeveelheid die Nederland "verondersteld zou hebben geproduceerd" in 2012, rechts het volume voor 2013 (in GWh). Zeer waarschijnlijk op basis van de in bovenstaande tekst weergegeven "eindejaars-capaciteiten". Nederland zou in een jaar tijd de productie van zonnestroom - ook al is het nog slechts een peuleschil - wederom ruim hebben verdubbeld, van bijna 254 GWh tot 582 GWh. Deze getallen zijn volslagen fictief, en kennelijk deels ontleend aan een "bijstelling" van de vermeende specifieke productie die "alle" installaties in een kalenderjaar zouden hebben gehad. Daarbij wordt echter geen rekening gehouden met twee factoren: (a) alle nieuw toegevoegde volume in een specifiek jaar heeft niet het hele jaar gewerkt, en kan dus sowieso geen (volledige) "specifieke kalenderjaar opbrengst" hebben gedraaid. En (b) kennelijk wordt het (geschatte) volume van 5 MWp off-grid voor 2013 hetzelfde behandeld als "netgekoppeld", anders kunnen de cijfers niet kloppen. Terwijl CBS jarenlang een veel lager "kengetal" heeft gebruikt voor off-grid systemen.
De "oude" getallen waren (volstrekt subjectief bepaald) 400 kWh/kWp.jaar voor off-grid, en 700 kWh/kWp.jaar voor netgekoppeld (reden verschil: duister). Voor "netgekoppeld" is door Stichting Zonnestroom na wat een "marktconsultatie" werd genoemd (Polder PV was erbij, en ook slechts één commerciële marktpartij met prima input) in het voorjaar een "consensus" voorstel gedaan. Daaruit rolde een "acceptabele" haalbare gemiddelde specifieke opbrengst van een "breed gedragen" (...) 875 kWh/kWp.jaar (voor "gehele kalenderjaar werkend systeem"!). Waarbij met de natte vinger is "afgesproken" dat dit "nieuwe kengetal" per 2011 gebruikt zou gaan worden om de vermeende NL zonnestroom productie vanaf dat jaar te gaan berekenen... Dat getal lijkt nu echter alleen voor 2013 gebruikt te zijn om de gehele "eindejaarscapaciteit" in "stroomproductie" om te rekenen. Terwijl voor 2012 "de oude kengetallen" lijken te zijn gebruikt. Anders kom je nooit in de buurt van of op bovenstaande fictieve opbrengsten uit:
** Nieuwe "kengetal"
Het lijkt er dus op dat er (a) inconsistent met oude en nieuwe kengetallen is omgegaan (i.t.t. de gesuggereerde "afspraak" dat vanaf 2011 met "het nieuwe kengetal" zou worden gerekend, wat alleen netgekoppelde systemen heeft kunnen betroffen). En (b) dat voor 2013 in het geheel niet (meer) met het veel lagere kengetal voor "autonome" systemen lijkt te zijn gerekend. Maar dat die installaties gewoon zijn "meegerekend" met (het nieuwe kengetal voor) de overgrote overmacht aan netgekoppelde systemen.
Gaan we uit van een "educated guess die in de goede richting zou zitten", komen we met genoemde geschatte 582 GWh vermeende zonnestroom productie in 2013 natuurlijk nog steeds op een fractie van het totale stroomverbruik (117 TWh volgens StatLine), en wel 0,5%.
Uiteraard, zoals zo vaak met NL zonnestroom statistieken, zullen deze cijfers nog beslist worden bijgesteld als meer harde gegevens beschikbaar komen.
In ieder geval blijft de conclusie onveranderd: niets is zeker, de zonnestroom productie wordt "berekend". En niet "gemeten". In dat opzicht is er ook met een nieuw "kengetal" niets veranderd in Nederland.
Geen
"netpariteit"!
Verder zou ik ook zeer voorzichtig zijn met het "hard" stellen
van het bereikt hebben van "net-pariteit" ("grid-parity",
cf.
SMZ) in Nederland, omdat de variabele kWh prijs in ons land in extreme
mate wordt gedomineerd door belastingen, zoals ik gedetailleerd
heb gedocumenteerd. Die hebben natuurlijk helemaal NIETS
te maken met de werkelijke "waarde" van de fossiel-gedomineerde
stroommix die in het net wordt gepompt. Ik zou daarom liever spreken over
het bereikt hebben van "energie-belasting-pariteit"
("energy-tax-parity"). Mocht de Staat om een of andere
reden het heffingen stelsel van energiebelastingen grondig gaan wijzigen,
kan dat hele zogenaamde "grid-parity" verhaal als een kaartenhuis
in elkaar gaan storten. Er komen steeds
meer donkere wolken aan de horizon op dat vlak...
Grafieken
met marktontwikkeling zonnestroom in EU28
Graphs with market development for photovoltaics in EU28
Figure 1. Note - all figure updates based on April 2014 report (Photovoltaic Barometer EurObserv'ER).
Accumulated capacity of photovoltaic installations in the EU28, in GWp (1 GWp = 1.000 MWp = 1.000.000 kWp), in nine consecutive years (2005-2013*) according to the latest data reported by EurObserv'ER. Data are from the last and previous Photovoltaic Barometer reports. Data for 2013 (asterisk) are preliminary and will change as new/adjusted market data will become available.
The graph shows strong growth in the years shown, except for a significant cooling-down in 2013, due to harsh measures by governments in big markets like Italy and Germany. In addition, grid-connected systems remain overwhelmingly dominant in Europe. Autonomous ("off-grid") systems make up only 0,23% of the EU28 PV market in 2013 (that used to be 4,7% in 2005 and 0,9% in 2009) and will dwindle even further in significance as the on-grid market grows with new volumes each year. Growth has been even negative between 2006 and 2007 for this small off-grid category. Growth in grid-connected PV has been strong in that period (over 59%), almost doubled to 113 percent from the accumulated 2007 capacity into 2008, and grew a considerable 58% in the economic "crisis" year 2009. Going into 2010, the market grew another extreme 84%, 2011 showed 75% increase. And started cooling down with a further 32% boost in another crisis year, 2012, and even only 14% in the "worst" of all years, 2013 (with market data now available). Accumulated capacity in EU28 amounted to 16,2 GWp in 2009, and an impressive 78,6 GWp in 2013. Almost five times larger in 4 years time, and almost 46% of which would have accumulated in Germany alone (over 36 GWp end of year accumulation 2013). Corrections of these data will probably follow in the next photovoltaic barometer report or the Barobilan inventory by EurObserv'ER.
CLICK
on graph for enlargement
Figure 2. New photovoltaic capacity per country and per year, in MWp (2006-2013). Order, from left to right, is related to the end-of-year accumulated market volumes per country for 2013 (note: preliminary data, numbers can change in later reports). Only numbers for 2013 are shown for clarity. If "0,000 MWp" has been given by EurObserv'ER, no data are shown in the figure. From this graph - note, with logarithmic Y-axis - it becomes clear that there are huge differences in market development in EU28 countries, and that fast growing markets develop in different time frames (e.g., Romania in 2013). In addition: such highly lucrative markets might dwindle in a short time if political backing of exceptionally succesfull incentive regimes collapses (e.g. Spain after its 2008 "boom year", Italy, Belgium and Germany in recent years).
In order of magnitude of "new capacity installed in 2013", the rating for EU28 looks like this:
Netherlands (yellow), the 7th biggest EU28 market in 2013, between France and Austria, will most probably have more new capacity installed than shown, since Klimaatmonitor already reported 680 MW accumulated capacity in their 10 April 2014 update for that year. Which results in at least 315 MW new capacity for 2013, and probably even much more, because not all data are known in that office (part of Infrastructure and Environment Ministry under "Rijkswaterstaat").
CLICK on graph for enlargement
Figure 3. Accumulated PV-capacity per EU28 country for the years 2005-2013 (only for 2013* accumulation is given in numbers for clarity). Again Y-axis in logarithmic scale. Sorting order is for accumulated capacity end of 2013, according to the latest EurObserv'ER data (left to right). Note absolute dominance of world market Germany, with almost 36 GWp accumulated, end of 2013 (in February of 2010, the 10 GWp milestone had been reached). For the year 2012 another - preliminary - world record increase (difference between green and dark-grey column, over 7,6 GWp in one year) is apparent for Germany. However, 2013 was the beginning of the "retreat" from long-time world champion with respect to new capacity installed (only half of the volume in the preceding 3 years).
Italy catapulted itself into comfortable second position behind Germany, with app. half that volume, and a more than respectable growth of 3,4 GWp in 2012. However, due to budget constraints, that market has also cooled off with less than half that volume (1,4 GWp) in 2013.
Spain, only one year (2008) worlds' biggest market for new installations, has completely collapsed in 2009 due to severe capping of the new capacity allowed under the FIT regime, regressive limitations to the amount of kWh's subsidized under previous (extremely lucrative) feed-in Law-conditions, accompanying regulatory bureaucracy, much lower feed-in tariffs for new installations, a very strongly opposed - but adopted - taxation regime for grid-connected installations, and a land in turmoil with several economic crisis situations. Data for 2010-2011 show a reasonable growth rate of 371-379 MW, but growth has again slowed down in 2012 (228 MW) to a meagre 102 MW in 2013.
France, although grown strongly in 2009-2011, could not live up to the expectations, and fell significantly back to a meagre addition of only 613 MWp in 2013 (that is including overseas departments, the so-called "DOM-TOMs"). In cumulation, it has almost reached the stagnant market volume of southern sunny neighbour Spain (both around 4,7 GWp).
"Surprise party" Belgium also had its heighdays, with enormous growth in 2009 in Flanders, ultimately reaching a considerable volume of 2,7 GW in 2013, after a very bad year (only 215 MW added). Respectable, but unsustainable with respect to its high incentives (including for big commercial installations). It will have to adept to very low volumes, until the shock of governmental cut-backs have left the memories of clients and entrepeneurs.
Following Belgium yet another 2 "flashlight" candidates, United Kingdom as the new kid on the block with heavy growth in 2011-2012, but a fall-back in 2013. Still, with its 2,7 GWp it is seen as a good market from which much is expected. "Post-crisis" Greece follows suit, with a surprising >1 GWp of growth in 2013, reaching a respectable 2,6 GWp end of that year.
Czech Republic is next in line, adding 409 MWp of new installations in 2009, but a staggering volume of 1.496 MWp in 2010, 3 and a half times as much as in the previous year. That market has completely collapsed in 2011, since dramatic measures have been undertaken by the government to stifle speculation in their country: growth zero! The 109 and 110 MWp added in the following years never could repair the damage done to its native market.
Two strongly growing east-European markets, Romania (with a spectacular rocket launch of 49,3 MWp end of 2012 to 1.022 MWp end of 2013), and Bulgaria, with 1.019 MWp end of 2013, close the "1 gigawatt group", which has already a size of 10 EU countries.
A group of 7 countries follow with accumulated capacities of 100 (Luxembourg) to Austria (690) MWp. It should be noted here that my country, Netherlands, certainly had much more installed than the 665 MWp indicated. The reason for this is lousy laws, very poor statistics, with very late reporting, and the non-obligation for PV-owners to register anywhere. However, our domestic market is teeming with activity and many hundreds of "players". Our market will certainly grow further strongly in coming years. The 1 GWp accumulation level could even have been reached, or, more likely, will be leap-frogged in one of the coming months in 2014. Actual monitoring data of the market are non-existent, the only reliable (but still questionable) monthly reports are from CertiQ, that only documents certified installations. These have fallen below 15% of total accumulated market volume...
Another 7 countries follow with low accumulated volumes between 11 MWp (Finland) to 68 MWp (Lithuania). New EU member Croatia is among them. The end-of-line is represented with very poor performing, but populated, coal-rich Poland to small Estonia, with numbers you better forget.
In the final column bar collection you will find total accumulated volume for EU28, with already 78,8 GWp of photovoltaic capacity. Alost 36 times the capacity in 2005, reached within 8 years time.
Note that for France, the results for the overseas departments ("Departements Outre Mer", DOM) also have been included in the (updated) accumulated data for 2009 by EurObserv'ER. In a previous report for that year it has been stated that they represented 25% of the grid-connected capacity in the whole country including DOM. This should be kept in mind if one wants to consider the European context focussed on the old subcontinent and its neigbouring isles. The "DOM" isles, French Guyana, and a small slice of Antarctica, all falling under a variety of administrative legislation frameworks, are scattered over the globe and are far removed from the direct "physical" influence sphere of Europe, see English Wikipedia map and accompanying clarifications.
CLICK
on graph for enlargement
Figure 4A. Accumulation of PV-capacity in EU28 countries per inhabitant/capita and per year. For this, the World Population Reference Bureau data for 2013 have been used in the calculations by Polder PV (hence: mid 2013 population as fixed reference, download pdf from website). Numbers shown for 2013 only, for other years refer to the scale of the Y-axis.
A very different picture emerges, with the small country Luxembourg as a suprising sixth on the podium (2009: on 3rd position), directly behind Czech Republic (5th) and the "solar champions" Germany (1, with 447 W/capita, approximately 2 modern PV-modules on average for all inhabitants there), Italy (2) and fast evolving Greece with its low population number (4). Belgium is the real surprise here, on position 3, with 266 Watt/inhabitant, not far from the 295 Watt/capita in Italy. If small Belgium will hold its rather unique position with respect to Greece remains to be seen, since the market in the former country has frozen considerably.
A few other newcomers showed sometimes surprising speed with respect to the Watt/capita ratio: Romania "exploded" from almost naught in 2012 to a level of 48 W/inhabitant in 2013, Slovenia (121), Denmark (95), Austria (81), the tiny mediterranean island Malta (62), Netherlands (40), and Baltic Lithuania (23 Watt/inhabitant in 2013) showed good progression with respect to the previous year.
In the next graph I have only presented the status for 2013, with descending order per country:
Figure 4B. Average capacity in Watt per capita per country in descending order (red), with average for EU28 added in green. 6 dominating countries "dictate" the high position of that EU28 average, the rest of the countries are placed beyond that level. Up till Lithuania, 2-digit Watt/capita numbers are apparent. The 8 last countries will have to do a lot to be accepted as "countries with an acceptable level of photovoltaics".
The ratio between Germany and Estonia is a factor 4.472 : 1. Although my own country Netherlands is in the process of heating up its own photovoltaic market after many years of poor support from the Hague, its 18th position between Cyprus and Portugal is not something to be proud of.
CLICK
on graph for enlargement
Figure 5A. Graph comparable to Figure 4, but this time the (land) surface area of the countries has been taken as reference for total PV capacity installed (in kW of PV installed per square km. of land). Again, World Population Reference Bureau data have been used, which were published in their 2006 report (data calculated from square miles into km² by Polder PV). Yet another picture emerges (data shown for 2013 only, order left to right based on installed capacity in 2013 according to EurObserv'ER data).
Related to surface available, Germany again taking the lead with almost 101 kWp per square kilometre of land available in 2013. Belgium has retained its second position (already reached in 2009) with almost 98 kW/km², only a small distance from Germany. The big surprise here is Malta, that has jumped from oblivion into the third EU28 country, which is of course related to its small size. Any "significant activity" with respect to installing megawatts of photovoltaics on such a small surface, will boost the kW/km² ratio. Little Malta (only 321 km²) added 18,1 MW of PV in only two years time (2012-2013).
Only three other countries have good kW/km² ratio's, Italy with over 58 kW/km² in 2013, another suprising small country, Luxembourg, with 39 kW/km², and Czech Republic with 27 kW/km². The rest has far lower ratio's. Average EU28 accumulation up till 2013 is 18,1 kW per square km. of land surface. That used to be 3,65 kW/km² in 2009, hence a 5-fold increase for this ratio, in four years time.
Figure 5B. Another representation of the kW/km² ratio, with status of 2013, countries in descending order. There are 7 countries to be found above the EU average (18,1 kW/km²). The rest is found below the average. Netherlands at first (in total country order: 8th position), with 16,3 kW/km², Estonia trailing far behind with only 0,004 kW/km². The ratio between champion Germany and Estonia is a factor 25.221 : 1 (far greater difference than with the W/capita ratio).
CLICK
on image for enlargement
Figure 6. Rating of ten (>13) best countries with respect to accumulated (total) PV capacity in 9 consecutive years (2013*, preliminary results, left, 2005 right, screendump of Excel spreadsheet). Germany and Spain leading the way from the beginning, Italy taking over 2nd position in 2011. France is still slightly below Spain in 2013, but probably will overtake that country in absolute volume since the pertaining crisis situation in the energy sector and in politics on the Iberean peninsula. Another shift will probably occur as United Kingdom, growing at high speed, will bypass Belgium's still respectable total volume in 2014. In blue frame, the first 10 "1 gigawatt markets" have been indicated for EU28. It is expected that at least 2 new players will enter that "class" in 2014: Austria and Netherlands.
Netherlands (marked yellow), once "the brave PV country bordering the North Sea", has for a long time given all its cards away and has gradually sunk from its respected third position in 2005 (due to a small market boom with excessive installation subsidies in 2000-2003) to an extremely bitter 13th position in 2011-2012, beyond reach of the "upper ten" list. Only in recent years, the Dutch market has been booming again, resulting in one step closer to the golden ten in 2013, but still on a 12th position, between Austria and Slovakia. It is, however, highly probable, that Dutch market data for 2013 will have to be revised upwards considerably, so maybe Austria's position might even be "threatened".
Most surprising newcomer, occupying the 24th position in the EU28 records for 2009, has been Slovakia, that shuttled itself into the 8th position in the 2010 listing of EurObserv'ER, with 174 MWp of accumulated capacity. In the previous year they only had 0,2 MWp according to EurObserv'ER. For 2013, Romania clearly is the most aggressively growing country with respect to PV deployment (in particular big installations). With a 9th position in 2013, while in 2012 the country occupied the 17th, and in 2011 even the 21th position.
CLICK
on graph for enlargement
Figure 7. Year on year growth percentages per country (all installations, grid-connected and off-grid). Several countries showed overall growth of, sometimes, many hundreds to even thousands of percents in their heigh-days, with Slovakia the ultimate exception - a growth rate of 90.629% in 2009-2010... General EU28 growth amounted to a sizeable 110% in the period 2007-2008. Further progress might have occured if policies would have been implemented to break the existing energy oligopolies, and to give maximum room for decentralized electricity generation. However, policies in big markets have become awkward of the high growth rates, and many incentive regimes have been scrutinized, bleached out, or have even turned into nightmarish scenario's like in Spain, seriously damaging its market. Hence, all-over EU28 growth rate in 2012-2013 has only become 14,4%.
CLICK
on graph for enlargement
Figure 8. EurObserv'ER also has published photovoltaic electricity production data for the countries investigated. In this graph data for the period 2011-2013 have been shown. Note that the Y-axis has a logarithmic scale. Countries are depicted in the order of total (assumed) electricity production in 2013. Germany in front with an estimated total of 30 TWh of solar electricity, a volume equalling that of 7,5 Borssele (NL) nuclear power plants if it would have worked at its max. level (which it did not in 2013, due to problems with the cooling system, it was put out of order in the winter, and only 2,7 TWh was produced).
Sunny countries with lots of PV capacity follow suit, like Italy (22,1 TWh), Spain (8,3 TWh), France (4,9 TWh), and Greece (3,6 TWh). The surprise again lies with small Belgium, with 2,4 TWh solar electricity production in 6th place, before Czech Republic and UK.
For Netherlands NO measured total PV production data are known (only for certified installations, registered at CertiQ, in 2013 less than 15% of market volume). The "582 GWh" given by EurObserv'ER can only have been calculated from the assumed (too low) "665 MW accumulated end-of-year-2013" capacity. By multiplying with a new supposed specific yield of 875 kWh/kWp.year for "all capacity end of year having produced the whole year". However, there is no national obligation to register installations nor production yields for the absolute majority of PV-systems. Hence, production data for Netherlands remain a mystery and only "educated guesses" can be made. Nothing more. See also explanation in Dutch above.
Total yield for EU28 in 2013 would have been 80,2 TWh of solar electricity (excluding concentrated solar power plants). That was 18,8% more than in 2012. Growth rate from 2011 up till 2013 on average had a CAGR of 33%/year.
Errors,
adjustments
In the past numerical errors, false entries and other "questionmarks"
have been known in
EurObserv'ER statistics. 2013 is no exception to that. For example, for
Slovakia, total capacity in 2013 is lower than in 2012 in the
same table (537,1 MW instead of the 541,1 MW mentioned in 2012). This
might be an error in historical numbers, since it is not plausible that
in a young market like Slovakia already 4 MW would have been "taken
away from the roofs" again. In addition, the country data for 2012
have sometimes been considerably adjusted with respect to the first publication,
one year ago.
New - and accumulated - capacity for Netherlands has already been adjusted upwards with respect to the last EurObserv'ER data, to at least 315 MW new, and at least 680 MW in accumulation. But it is expected that there is no end in the "upward" adjustments yet, for the Dutch 2013 market. Hence, the mentioned "300 MW new" and "665 MW accumulated" must be considered as the absolute bottom-line.
http://www.eurobserv-er.org/
(homepage of EurObserv'ER)
http://www.prb.org (data
sheets on world population and (2006 version) surface area by country)
Further
reading:
http://www.epia.org/
(European PhotoVoltaic Industry Association, EPIA)
Pagina gepubliceerd op 12 mei 2014. Verwijzing naar update cijfers toegevoegd 10 maart 2015.
|