| |
  
Solar
electricity (photovoltaics) in Flanders and Belgium
Section
I - Resumé of monthly VREG reports (status March 2, 2012)
Section II - New statistics with evolution of yearly
progression in PV capacity and number of installations (status: July
3, 2012)
Section III - Belgium market (status: May 2,
2012)
(updates
of monthly data postponed due to busy activities Polder PV, refer to the
July 3, 2012 data for good actual overview!)
Note:
Percentages mentioned are often rounded, and not always will add up to
exactly 100% in totals for a year.
On this webpage an
overview of development of photovoltaics in Flanders (Belgium) is made
in a few graphs, also highlighting the position in relation to other "renewable"
electricity options (Section I).
This page is an extension
of the webpage with the detailed monthly updates with many more graphs
highlighting the Flemish and Belgium PV-market. See the main
page.
Graph updated based
on March 2, 2012 month reports by VREG (Section I)
and the most recent Excel file "Evolutie van het aantal zonnepanelen
en hun vermogen" (misleading title translated as "Evolution
of the number of PV-modules and their capacity"), update published
by VREG on May 2, 2012 (Section II). Note that,
under normal conditions (synchronized reports), accumulated results between
the two datasets may differ slightly because of the period of sometimes
several days between their publication dates.
Section
I - Resumé of monthly VREG reports (status
March 2, 2012)
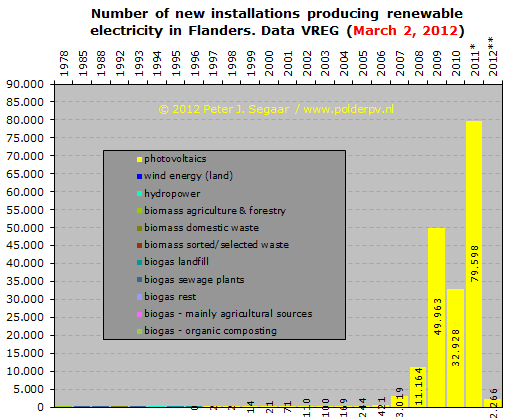
Fig.
1 - This graph shows the number of new PV-installations
per year registered with VREG able to claim green certificates for "renewable"
electricity. Since the number of PV-systems is so overwhelming with respect
to the few installations for the other "options", the latter
can not be seen on this scale. To view their contribution, refer to the
detail graph in Fig. 2.
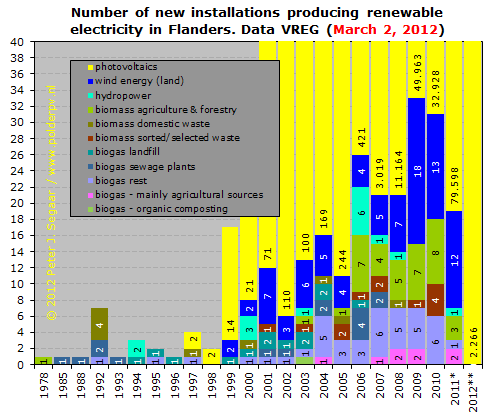
Fig.
2 - Detail of Fig. 1 showing the contribution of all the
other "renewable" electricity options (PV-installation number
going completely off-scale in this graph). Beyond photovoltaics, the biggest
contributor with respect to "number of installations" appear
to have been "biogas rest", windpower and biomass installations
using materials from forestry and/or agriculture. Number of PV-installations
appear at the bottom of the yellow columns. Note that, starting with the
Feb. 1, 2012 report, a new option has been included (possibly better:
split-off), biogas (mainly) from agricultural sources (pink column segments).
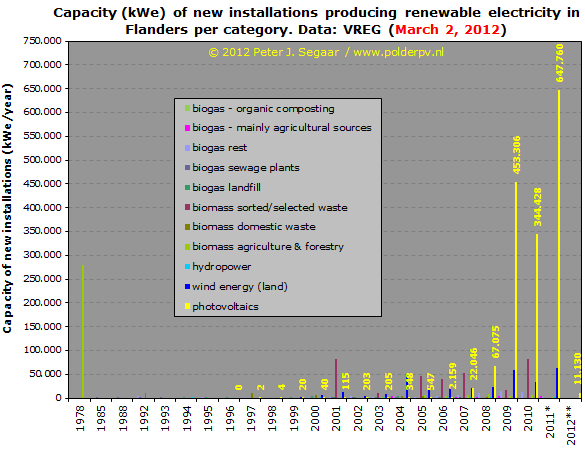
Fig.
3 - Comparable to Fig. 1, but now showing the nominal
capacity of the accumulated "renewable electricity" generating
installations per year, in kWe. Options are grouped per year and are shown
with separate columns. For PV, MWe is the maximum AC-power of the inverters.
Even on this power capacity scale, PV-installations dominate all other
renewable options. Note that in 2011 total capacity has bypassed the volume
known for previous record year 2009 by far (already with 43%, and more
to come). In the January 1, 2012 report strangely a large 280 MWe installation
for the (previously unlisted!) year 1978 has been introduced, processing
biomass from agriculture and/or forestry (large green column at left).
In the same publication an installation in that category listed for 2005,
and with a capacity of 130 MWe, has been removed, also for unknown reasons.
For detail of a stacked graph, see Fig. 4.
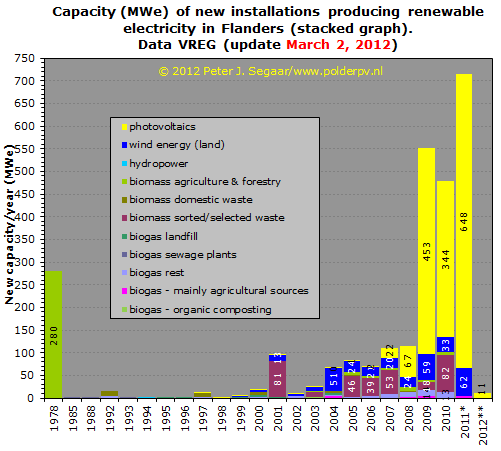
Fig.
4. Stacked graph with all renewable electricity generating
options on top of each other, per year. The impact of photovoltaics is
impressive: it has most (accumulated) capacity of all options, although,
of course, it cannot generate as much since installations only produce
electricity in daylight hours. Preliminary accumulation for 2011 has now
reached 648 MWac for PV. Already far beyond the (preliminary) total new
capacity in 2010, and also beyond reach of the previous record year 2009
volume. Note also the old single large new installation for agriculture/forestry
biomass conversion at left (introduced in the Jan. 1, 2012 report). For
2012 only little new capacity has been registered with VREG (approximately
11 MWac).
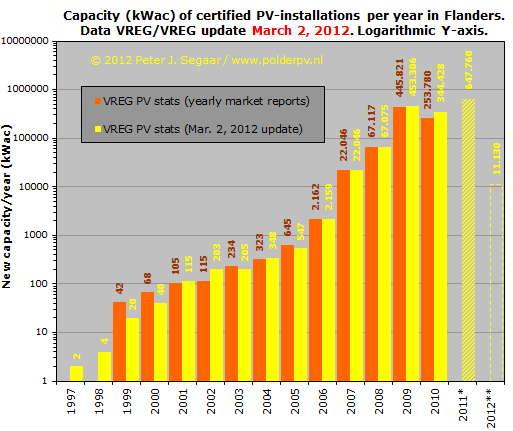
Fig.
5 - In this graph the new capacity of photovoltaic installations
in Flanders is shown per year. In orange columns the older data (derived
from the last year report for 2010). In yellow columns the revised data
in the last month report. 2011 in a dashed column, 2012 in an open column
(preliminary results for Jan. - Feb. only). Note that data for some years
still can be adjusted, with largest changes expected for most recent years
(2009 and, in particular, 2010 and 2011). 2010 has shown considerably
less growth than record year 2009. 2011 has turned out to be a surprising
good year reaching a new record volume far beyond that of 2009...
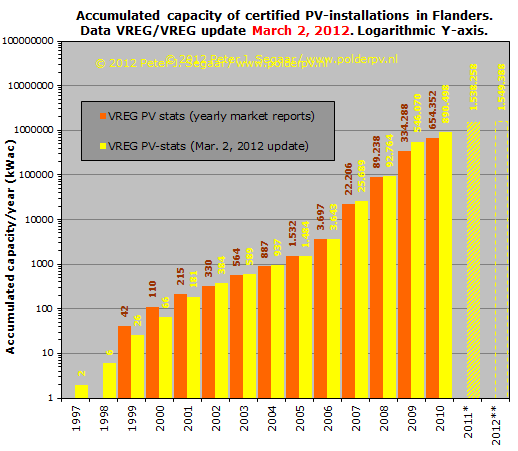
Fig.
6 - Graph comparable to Fig. 5, but now with accumulation
of photovoltaic installation capacity at the end of each year (or, for
2011, as published in the last month report). With most recent data in
the monthly reports, accumulation has already reached a level of 1.549
MWac, which could result in a nominal DC capacity of app. 1.704 MWp. In
the summer of 2011, the magic "1 GWp barrier" has probably been
broken in Flanders. In Belgium as a whole, that could have happened in
early summer of that year (the other 2 markets, Walloon region and Brussels,
are (as yet) too small to have a serious contribution on top of the Flanders
data, see original statistics page
on Belgium).
Section
II - New statistics with evolution of yearly progression in PV capacity
and number of installations
(status: July 3, 2012)
This series of graphs
has been made using year data made available in a separate spreadsheet
(and/or pdf) from VREG with data per year and/or per quarter. The data
in this specific document can differ slightly
from the data that are presented in the mostly accompanying month reports
(graphs in Section I), since they are not always
published at exactly the same date. Hence: accumulation data etc. shown
in this section might deviate slightly from those extracted from the data
in the monthly reports. The "timing" of this specific spreadsheet
might be shortly before, or shortly after the monthly VREG report. For
the first results of 2012, see the final figure in the third
series.
Data processed with
Excel 2010.
First series:
evolution in the calendar year 2011 (adjustments up till update in July
3, 2012 VREG spreadsheet).
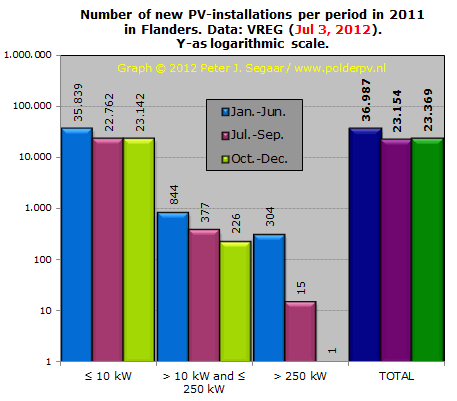
Fig.
7 - Updated results for the (whole) year 2011
(will be further adjusted in coming reports!). For previous versions:
May
2, 2012, April
1, 2012, March
1, 2012.
Number
of new PV-installations per period. VREG has divided the "population"
of new PV-installations into three big categories: installations up till
10 kW (AC), those with AC power larger than 10 kW, up till 250 kW, and,
finally, the largest category with AC power over 250 kW. In their 2011
overview, VREG has again divided the new capacity into three periods for
2011: First half year - January up till June (blue columns), third quarter
- July up till September (purple columns), and last quarter - October
up till December 2011 (green columns). Additions for the whole calendar
year are given in the final column group at far right in slightly deviating
colours.
The Y-axis
has a logarithmic scale. Note that in the third and fourth quarter of
2011 more installations have been registered by VREG (22.762 + 23.142
= 45.904) as in the first half year for the smallest category (35.839).
The larger categories, however, dropped off considerably with new installations
in the two final quarters in 2011: 603 (Q III + IV) instead of 844 (Q
I + II) for category 10 - 250 kW, and only 16 instead of 304 for the largest
category >250 kW. Ratio for total numbers (final column triplet) is
also higher (45.523) with respect to that for the first half year (36.987).
In the present update, the fourth quarter of 2011 saw a negligible volume
of 215 installations more than in the third quarter, an increase of less
than 1% (note that in the report at the start of February 2012, a difference
of 16% less installations were reported for the final quarter
related to the previous one).
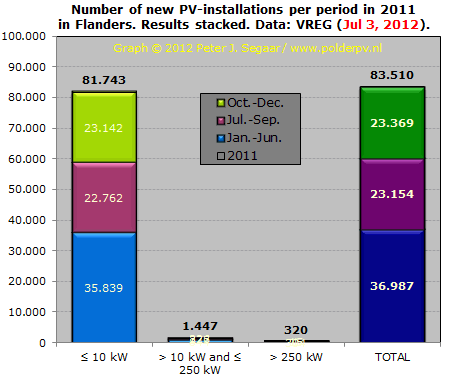
Fig.
8 - Figure comparable to Fig. 7, but now results for the
three periods discriminated by VREG for the year 2011 have been stacked
on top of each other and given for all three categories as well as for
total for all installations (far right). For previous versions: May
2, 2012, April
1, 2012, March
1, 2012.
Y-axis
now is in normal mode to show the huge impact of the numbers of installations
within the smallest category (up till 10 kWac). Total installation number
in this VREG update has reached a volume of 83.510 for the year 2011 (March
1, 2012 report: 79.520, an increase of 5,0%). Shares for the three periods
shown are 44,3% (first half year), 27,8% (July up till September), and
28,0% (final quarter), respectively.
1.767
new installations (or: portions of larger systems) >10 kWac have been
reported sofar by VREG for the record year 2011. 320 (18%) of these installations
(or portions of big ones) had sizes over 250 kWac.
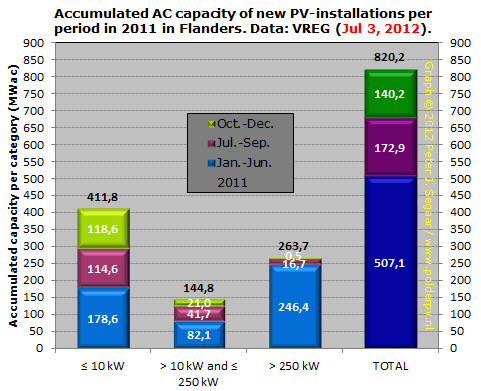
Fig.
9 - Figure comparable to Fig. 8, but now accumulated capacity
(MWac) has been shown. For previous versions: May
2, 2012, April
1, 2012, March
1, 2012.
This
gives a somewhat different picture, since the relative "few"
installations in the two bigger installation categories have a considerable
volume of capacity. 144,8 MWac new in 2011 for the category 10 - 250 kWac,
and an astonishing 263,7 MWac for the largest category > 250 kWac.
Please note, that in the March 1, 2012 report, that latter volume was
only 167,1 MWac, and that in the May 2, 2012 report, even a volume of
329,9 MWac has been published. Apparently, a considerable volume (66 MWac!)
has later been withdrawn by VREG for unknown reasons.
A volume
of 21% of newly reported capacity in 2011 has been added in Flanders in
the third quarter of that year. The fourth quarter has added 17% of total
volume. In combination with the high level of 411,8 MWac now accumulated
for the smallest category (up till 10 kWac), total new capacity added
in 2011 already has reached a volume of 820,2 MWac. Please
note that this has changed from 641,6 on March 1, via 815,5 on April 1,
and 845,3 MWac in the May 2, 2012 report. Hence, after strong increases
in monthly updates, some 30 MWac appears to have been "withdrawn"
from the 2011 records between the May 2 and July 3, 2012, reports.
If a
conversion factor of 1,1 is applied (DC capacity = AC capacity * 1,1),
new nominal STC power added in 2011 could already have reached an astonishing
level of 902 MWp, which is an exceptionally good result for a small region
like Flanders.
Please
note that, if the conversion factor has been applied in a reliable fashion,
this capacity outstrips the recently published total new capacity for
the whole of Belgium in 2011 in the Eur'ObservER report for that year
(publ. April 2012, see download
web page): market growth would have been only 775,5 MWp for Belgium
as a whole, according to this first Eur'ObservER estimate. A difference
of over 16% with the calculated volume for Flanders only based on most
recent VREG data for that year! Also the highly respected analyst bureau
of NPD Solarbuzz seems to have seriously underestimated total volume for
Belgium in 2011 (graph on their market
report web page). With the >100 MWp for Wallonia, total growth
for Belgium must have been a substantial >1 GWp in 2011 (slightly more
volume may be added by VREG in coming reports). Which could result in
Belgium becoming the fourth largest growth market in the European Union
in 2011, beyond Big Brother United Kingdom...
Strongly
depending on the realisation in India (as of yet not known, Photon's meta
analysis of October 2011, for example, suggested an installed capacity
of 500 MW for 2011, SolarPlaza suggested much
lower market volume for India in 2011), Flanders could ultimately
even have realised almost quadruple that volume of PV-installations in
2011 than in that booming new (strongly utility scale-driven) market in
the biggest democracy on earth (1,24 billion inhabitants mid 2011, PRB
data)...
Second
series: Evolution of PV-installations over the years.
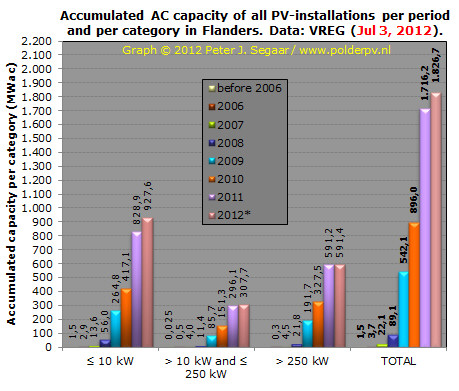
Fig.
10 - Evolution of accumulated PV-capacity (MWac) per category
and per year (2012 premature results for first half year). For previous
versions: May
2, 2012, April
1, 2012, March
1, 2012.
Progression
for the smallest category ("residential market") has been considerable
up till 2011 (a good sign of a "committed and mature" market,
with strong support of the population!). Also, volume of the largest market
segment (>250 kWac) has grown strongly, in particular as of 2009 (the
"boom" in 2011 has, however, been stalled in 2012 since green
certificate value for new installations has dwindled to an equivalent
of only € 0,09/kWh). The (revised) accumulated total volume of 89
MWac end of 2008 has grown very fast to a volume a factor 19,3 times larger,
reaching a highly impressive level of 1.716 MWac in 2011*,
and (preliminary results) 1.827 MWac in the first half of 2012. Note that
in the present year, only some growth has occurred in the smallest category.
The market segments >10 kWac have almost come to a stand-still. The
same may apply to the rest of the market, as the Flemish government has
decided that green certificates will not be worth more than €ct 9/kWh
for new installations as of August 1, 2012...
*
Note: on July 24, 2012, the "market
data" web page of branche organisation PV-Vlaanderen still depicted
ancient, end of January 2012 data for 2011, claiming only 1.476 MWac accumulated
capacity (see Fig. 10 for actual number), and a year growth of only 592
MWac for that year (for the latter, see Fig. 11; hence underestimating
14% and even 28% of volumes reported in the July 3, 2012 update).
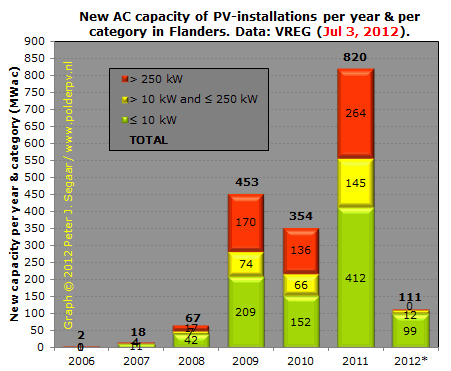
Fig.
11 - New AC capacity per year and per category, stacked
columns. For previous versions: May
2, 2012, April
1, 2012, March
1, 2012.
2011
is - by far - the best year for Flanders, with already an incredible volume
of 820 MWac (in the March 1, 2012 report that used to be only 642 MWac)
new PV-capacity, of which an impressive portion of 412 MWac has been delivered
by small installations up till 10 kWac (50,2%), 145 MWac by installations
> 10 kWac and up till 250 kWac (17,7%), and 32,2% (264 MWac) by larger
installations. The impact of the smallest category is bigger than in the
years 2009 (previous record year, share 46,1%) and 2010 (share 42,9%).
The large volume of > 250 kWac installations in 2009 can be attributed
for a considerable part to the famous multi-site 40
MW project by Katoen Natie delivered end of that year. 2011 already
has a factor 1,8 times the new volume of previous record year 2009.
However,
thick dark clouds are already raining out on Flemish territory. The market
has dwindled in the first half year of 2012, and is expected to collapse
completely as of August (green certificate value for all new installations
max. 9 Eurocent/kWh). Up till now only 111 MWac has been reported by VREG
in 2012. Almost entirely consisting of smaller residential installations.
Flanders has had its heyday, and will enter a new Dark Age if the government
does not change their policy with respect to photovoltaics.
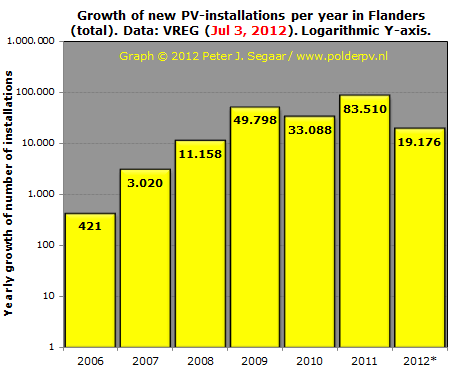
Fig.
12 - New number of installations (total only, number is
dominated by the smallest installation category by far, see Fig.
7) per year. Logarithmic Y-axis. For previous versions: May
2, 2012, April
1, 2012, March
1, 2012.
In most
years more installations were registered by VREG than in the previous
year, with the exception of 2010, and, to be expected, a collaps in 2012
(first preliminary half year results shown only). Total of 83.510 in 2011
signifies a volume a factor 198 bigger than the new volume registered
for the year 2006, and has been over a factor 2½ the volume realised
in 2010.
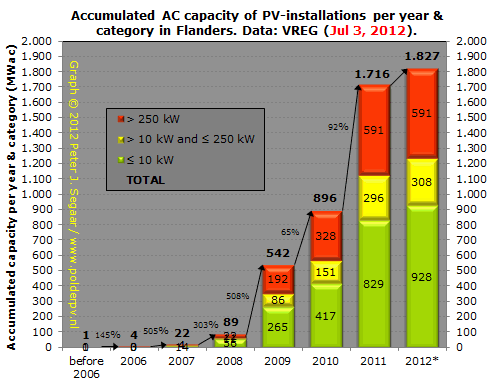
Fig.
13 - Accumulation of AC capacity of PV-installations in
Flanders up till 2012 (note: preliminary data for first half year of 2012);
graph with three different system size categories stacked per year column.
For previous versions: May
2, 2012, April
1, 2012, March
1, 2012.
End of
2011, Flanders had a minimum of 1.716 MWac (possibly in the order of 1.888
MWp nominal DC capacity), with contributions of 48,3% (smallest <=10
kWac), 17,2% ("medium"-sized) and 34,4% (largest installation
categories). Year-on-year (YOY) growth percentages (small-printed numbers/arrows)
have been staggering for Flanders, ranging from 145-508 percent/year up
till 2009, and still showing very strong growth in the periods 2009-2010
(65%) and 2010-2011 (92%). The final number for 2011 may still change
a bit, since full capacity additions for 2011 might still not be complete
(VREG updates "older" capacities in new reports). 2012 has been
a dramatic year for installations >10 kWac, and will become even darker
as the green certificate value for smaller installations will drop dramatically
from 23 to 9 Eurocent/kWh as of August 1, 2012 (see webpage
VREG with tariff changes; for Dutch
abstract of political background of these changes look here).
Status
on July 3, 2012 is that 1.827 MWac has been registered by VREG. This could
be an equivalent of slightly over 2 GWp (if DC capacity
is considered 1,1*AC capacity).
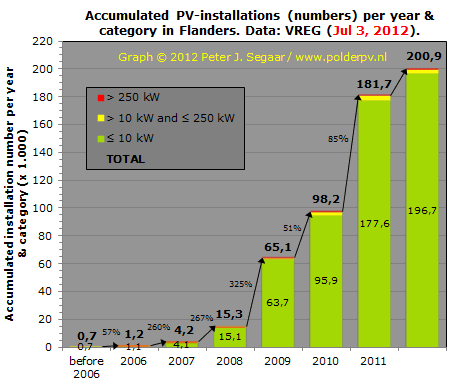
Fig.
14 - Graph comparable to the one shown in Fig. 13, but
now number of PV-installations accumulated end of each year is given.
Y-axis and numbers are given in thousands. For previous versions: May
2, 2012, April
1, 2012, March
1, 2012.
That
number is, of course, dominated by the "small" category up till
10 kWac (green column segments), that reached a preliminary high level
of 177.596 installations end of 2011, 97,7% of total volume of 181.734.
With data presently available, growth 2010-2011 has been a very strong
85,0% YOY. In the first half year of 2012, only the smallest category
grew notably, with total number of PV-installations reaching a record
level of 200.910. Note that the "Vlaamse Gewest"
(that is Flanders, without Brussels) had 6.251.983 inhabitants in 2010
(Wikipedia).
This means that, calculating with 196.670 smaller installations end of
June 2012 (max. size 10 kWac), on average one in 31 inhabitants "could
have" a PV-installation on its premises. A good start of a truly
decentralised energy (electricity) revolution.
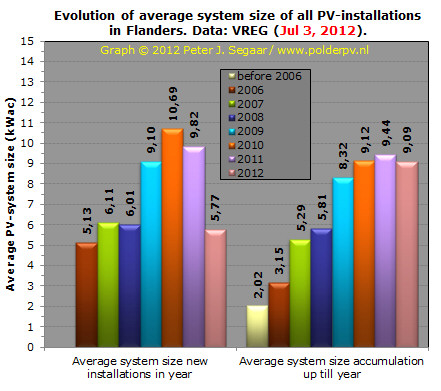
Fig.
15 - In this graph the evolution of the average PV-system
size in Flanders is given based upon the last available data published
by VREG. With preliminary results for the first half year of 2012.
In the
left column series average system size has been shown for the new PV-installations
in the (part of the) year depicted, in the right column series the average
system size for all accumulated installations end of the (part of the)
year has been shown. In the former series average size varies from year
to year, with a notable "new year installation record" of 10,7
kWac on average in 2010 (many large installations have been reported in
that year, increasing the system average). Due to strong degression of
the value of green certificates to be obtained by larger installations,
and the resulting collapse of that market, system average in 2012 has
strongly decreased (5,8 kWac in first half of the year): only the small
residential market segment is still growing (probably up till July), the
bigger two segments did not show any significant "activity".
The second
group shows stepwise increase of system average of ALL (accumulated) installations,
with a temporary "stall" in 2008. An important factor in the
decrease of growth in the average system size has been the strong growth
in the most important sub-market of all, the residential market, in record
year 2011 (see Fig. 10 and Fig.
12 for impact). Resulting in 9,4 kWac on average for all installations
end of 2011, which has receded to a level of 9,1 kWac in the first half
of 2012.
In conclusion,
since 2006 Flanders has reached very good results in the global records
for photovoltaics. It remains to be seen if there will be an attractive
business-case left for larger installation categories (as of Jan. 1, 2012,
the value for green certificates has dwindled to 9 Eurocent/kWh for installations
> 250 kWac), as module prices drop further. The same will apply to
the residential market segment, as of August 1, 2012.
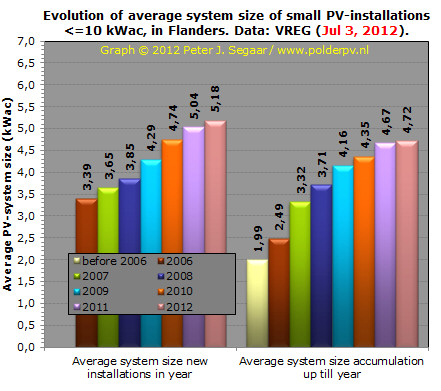
Fig.
16 - Graph comparable to that shown in Fig. 15, but now
only the residential market segment <= 10 kWac has been shown.
This clearly shows
the continuous upward trend in average system size newly installed on
private houses and smaller commercial dwellings. As of 2006, that average
has increased from 3,4 up till 5,2 kWac (possibly equivalent to DC generator
sizes of 3,7 up till 5,7 kWp). In the second half of the figure, average
system size of all <= 10 kWac installations also increased in course
of time, ending in the second half of 2012 with an average size of 4,7
kWac (app. 5,2 kWp). That is much higher than in neighbouring Netherlands,
where residential system size is often between 1 and 4 kWp, with many
installations sized 1-2 kWp or even smaller (actual status impossible
to pin down, since most installations in Netherlands are not registered
in a public register...).
Third
series: evolution in the calendar year 2012.
The February 6, 2012,
"global" update by VREG provided first results for 2012 and
have been updated in later monthly 2012 reports. In the final figure of
this section I present the first results for new capacity registered.
It is a rather modest volume, because the implementation of large installations
seems to have stalled completely. Further reports will have to be awaited
to see if the Flemish market really seems have come to a "stand-still"
such as branche organisation PV-Vlaanderen has suggested early in the
year. Volumes in the max. 10 kWac market segment have been growing - end
of June 2012 already 99 MWac has been registered for that category, which
could amount to a volume of app. 109 MWp. Neighbouring Netherlands realized
a volume of only
43 MWp in the whole of 2011, according to first (preliminary) data
by CBS.
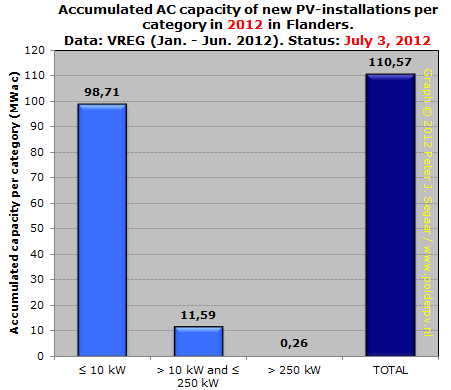
Fig.
17 - First results for 2012 / first half year (preliminary
data): only 11,6 MWac additions for the smallest of the two "large"
categories, almost zilch for the category >250 kWac, and a
"relatively modest" volume of 98,7 MWac (March 1, 2012: 10,6
MWac) addition for the residential market segment (note that Y-axis is
in MWac!). It remains to be seen if these first data for 2012 would suggest
an under representation because of VREG administration lagging behind
in the new year, and/or that the Flemish PV market really has "collapsed"
(which is plausible). And if yes, if that "collaps" will endure
in a year that large volumes of very cheap PV-modules accumulate in the
harbours of Antwerp, Rotterdam, and Hamburg. For the residential market
(installations up till 10 kWac) volume is relatively low, and the big
question is if the first of August will be Doomsday for Flanders, or if
people still will buy PV-systems after the holiday season...
Section
III - Belgium market (status:
May 2, 2012, must be updated)
In this section the
latest known data for the three markets in Belgium, Flanders, Walloon
region, and Brussels, have been synthesized in two figures:
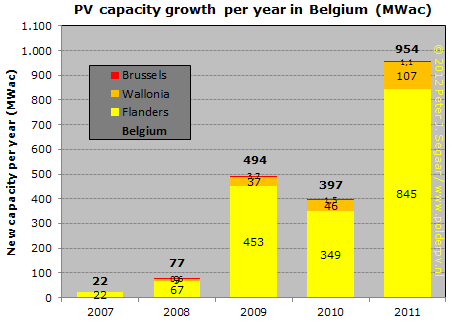
Fig.
18 - Preliminary results for year growth of PV market
in Belgium. Results for 2011 can change, in particular with respect to
the volume for Flanders, the most dominant market in this country. Numbers
for the Walloon region and for Brussels have been originally derived from
preliminary estimates by Apere, end of 2011. For Walloon region, preliminary
volume of approximately 107,4 MVA for PV has been assumed based on a CWaPE
update date-stamped February 29, 2012. For Brussels no new data for 2011
are known (regulatory body: BRUGEL). Status is that at least 954 MWac
has been added in Belgium in 2011, with more volume to be expected. This
could account to a new DC volume of app. 1.049 MWp.
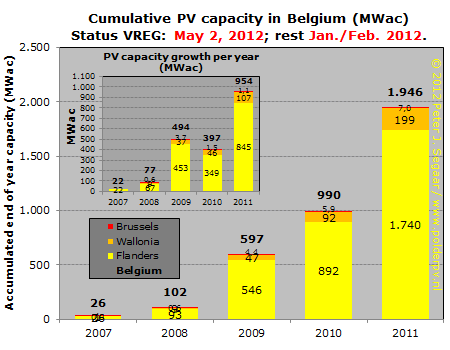
Fig.
19 - As Fig. 18, but now the main figure shows accumulated
capacities at the end of the year and, for reference, the year growth
in the inset. Already, the small country Belgium, had accumulated 1.946
MWac of PV capacity, end of 2011 (1.740 MWac for Flanders). Which might
translate into a record breaking 2.141 MWp of nominal STC (DC) generator
capacity, the second "Gigawatt" (DC) certainly already broken.
An astonishing volume for a small country like Belgium.
With
later additions accumulated in the May 2, 2012 VREG report, total capacity
for Flanders now has already reached 1.797 MWac, with an expected DC volume
of approximately 1.977 MWp. Hence, in the coming report to appear around
June 1, 2012, it is highly likely that Flanders only will break its own
2 GWp barrier. A phenomenal achievement.
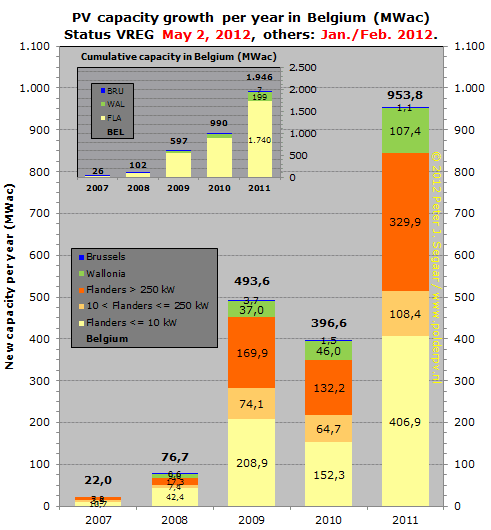
Fig.
20 - Update from the original figure added to Segaar's
Solarplaza / Solar Future Belgium article (published
March 6, 2012, with older VREG data from Feb. 6, 2012). In the present
version, the status of Flemish data published by VREG on May 2, 2012 has
been shown (more recent data for the other two sub markets not yet known,
Walloon region has been updated with preliminary CWaPE data for 2011).
Segmentation of the Flemish market in three categories for main figure
(capacity, MWac). Inset: accumulation end of each year for the three sub-markets.
Link
Statistics renewable
electricity in Flanders:
http://www.vreg.be/statistieken-groene-stroom
Webpage
made up for the first time May 18, 2011.
Updates: August 23, 2011 (VREG monthly report, publ. Aug. 1, 2011); October
11, 2011 (VREG Sep. 1, 2011 report), October 24, 2011 (VREG Oct. 1, 2011
report), November 23, 2011 (VREG Nov. 1, 2011 report), December 12, 2011
(VREG Dec. 1, 2011 report), January 9, 2012 (VREG separate statistics
file yearly evolution [addition of "Section
II"], Jan. 4, 2012), February 1, 2012 (VREG Jan. 1, 2012 report),
February 19, 2012 (VREG Feb. 1, 2012 month report and Feb. 6, 2012 Excel
file), March 15, 2012 (VREG Mar. 1, 2012 Excel file year data, addition
of updated segmentation graph Fig. 19), March 30, 2012 (VREG month report
March 2, 2012 >> section I updated), April 20, 2012 (VREG Apr. 1
pdf year data), May 5, 2012 (VREG May 2, 2012 Excel file), July 24, 2012
(VREG July 3, 2012 Excel file).
|