
Weltmeister
in numbers
| |
|
||||||
|
Weltmeister
in numbers |
index | ||||||
|
|
|
||||||||||||||||||||||
^^^ On July 27 2010, BNA reported that June 2010 could have seen 1,7 GWp of new PV-installation capacity. The (preliminary) data of BNA (originally September 29, 2010, revised October 21, 2010) revealed, however, that a far more astonishing world record was claimed by the owners of brand-new PV-installations in that month. An incredible amount of 2.109 MWp* with over 65.000 new installations (in that month only on average 2.169 new PV-systems were reported to BNA per day). Just in time to opt for the "old" 2009 EEG Novelle feed-in tariffs before they were slashed with percentages up till 13% as of July, 1. This huge amount of new installations went far beyond the record in December 2009 (revised Oct. 21 2010: 1.449 MWp new) with a difference of 660 MWp (in that previous record month on average "only" 1.356 installations were recorded per day by the BNA office). After the June record installation, two "feeble" months followed, in which new installations can claim lower feed-in tariffs as in record month June. Still, new capacities remain impressive and unique on this planet: according to the revised BNA data 663 MWp in July, and still a hefty 363 MWp in the German holiday month August (new capacity 291 MWp in August 2009). The September 2010 results were originally date-stamped October 21, but appeared in a seemingly older spreadsheet in a strongly revised version date-stamped December 23, 201 (discovered in March by Polder PV). Data for October 2009 up till August 2010 were also slightly revised in the October 21, 2010 update (see separate graphs revealing the changes). September again revealed a surprising strong growth of new installations and capacity, much stronger than orginally appeared (see comparison of day-to-day reports further below): 27.843 with a total name-plate capacity of over 654 MWp. That was before the additional 3% degression as of October 1, leading to lower growth in October with (preliminary data:) 12.502 new installations and 341 MWp of new capacity. November 2010 saw comparable new volumes as the previous month: 12.459 new installations and 360 MWp newly reported capacity installed. Finally, December 2010 did not show record new volumes, although in view of the freezing conditions and lots of snow- and ice, market volume was formidable: 1.174 MWp new capacity and almost 24.000 new installations. In total, adding up the already revised data for January up till September 2010, and the preliminary reports for October up till December, 2010 saw an enormous new market volume of 7.408,3 MWp and almost a quarter of a million new PV-installations (registered entries in the BNA spreadsheets).† With the new and slightly revised monthly installations, total accumulated German PV-capacity has broken the 15 GWp barrier in September 2010, and surpassed 17 GWp end of December. That impressive volume has been reached in a very short time after breaking the "magic"10 GWp barrier (accumulation of grid-connected PV-systems) in January or February 2010, depending on the data source for accumulated MWp level in previous years. For the new 2009 volume (white column segments) I have included the data from Photon's net manager statistics review available on their website and published in the German Photon magazine in September 2010: 3.867 MWp (resulting from a slight correction for non-responding net managers, and calculating the expected MWp volume from the kWh feed-in reported in their region). This number from Photon is only slightly higher than the preliminary, slightly revised BNA accumulation (3.802 MWp for 2009), showing that these preliminary BNA data appear to be rather accurate (difference only 1,7%). The BNA data can, however, still change, as final data for 2009 and preliminary data for 2010 will only become available in March 2012. *
Data revised by BNA on October 21, 2010 (previously
reported for June 2010: 2.126 MWp).
Graph obtained from data by Photon (yearly published net manager |
Revision
of previous data published by Bundesnetzagentur (October 21, 2010)
(including two graphs)
Grafieken/Graphs BNA (PV-capacity Germany
2009-2010)
1. Capaciteit per maand/Capacity per month
2. Accumulatie capaciteit per Bundesland 2010/Accumulation
of capacity per Bundesland 2010
3. Verschil groei maandcapaciteit 2009-2010/Monthly capacity
growth differences 2009-2010
4. Accumulatie aantal installaties per Bundesland 2010/
Accumulation of number of installations per Bundesland 2010
5.
Verschil groei maandelijkse installaties 2009-2010/Monthly
installation growth differences 2009-2010
6. Groei per installatie categorie 2010/Growth per installation
category 2010
7. Aantallen en systeemgrootte per Bundesland 2010/Numbers
and system size per Bundesland 2010
8. Gemiddelde systeemgrootte per categorie 2010/Average
system size per category 2010
9. Groei per maand 2009-2010/Growth per month 2009-2010
10. Progressieve ontwikkeling van de PV-markt in Duitsland
in 2010/
Progressive development of Germany's PV market in 2010
11. Kwartaal overzichten 2009-2010/Quarterly reports
2009-2010
12. Grafieken
met BNA registraties per dag en per week/Graphs with BNA registrations
per day and per week
Photographs:
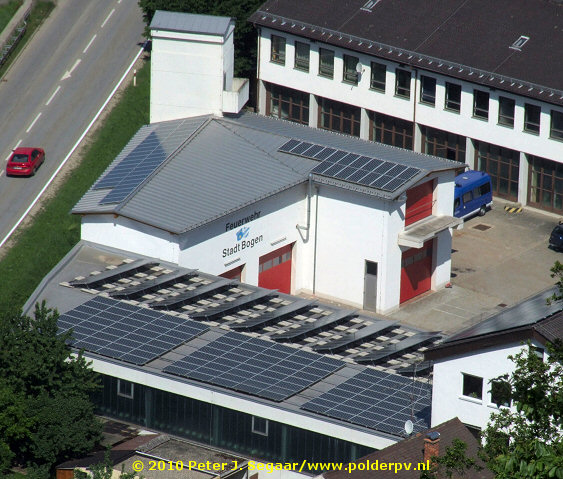
Bogen
firebrigade building, eastern Bavaria
Gänsdorf-Straßkirchen
> 55 MWp solar parc, eastern Bavaria
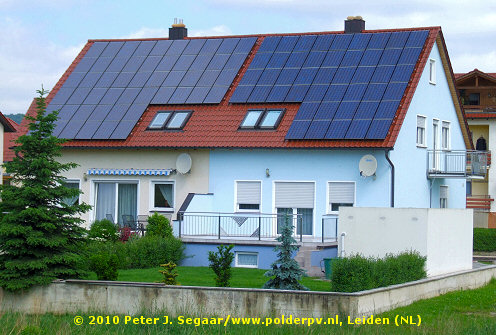
PV roof on "zweifamilien"
dwelling in Tegernheim, eastern Bavaria
Appartment complex with PV in Simbach,
SE Bavaria
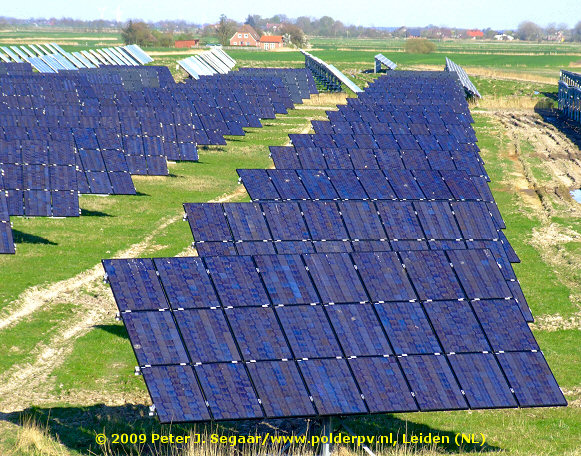
Solarparc Rodenäs, Schleswig-Holstein
Ducking ostriches not allowed in PV-module
rich SW Bavarian Halden
BRD
PV-marktanalyses
2012 2011 2010-II
2010-I 2009
2008 2007
def. 2007 cf. BSW 2006
2005
Op deze pagina een eerste inzage in de realisatie van hernieuwbare elektriciteit inclusief zonnestroom in Duitsland in 2010, volgens cijfers van - grotendeels - het BNA (Bundesnetzagentur), een ambtelijke organisatie onder het Bundeswirtschaftsministerium ("EZ van Duitsland").
Update: Maart 2011. December 2010 update bekend gemaakt. Nieuwe installaties sinds de laatste updates, BNA spreadsheet gedateerd 7 februari 2011, en revisie van vorige maandcijfers (gepubliceerd 21 oktober 2010, alsmede de goed verstopte revisie van september 2010, gepubliceerd 23 december 2010):
* Wereld maandrecord, het vorige record van 1.461 MWp verpletterend (December 2009, ook in Duitsland). December 2010 komt hiermee op de derde plaats qua nieuw volume.
** Dat waren in mijn vorige berekening (toen de update voor die maand mij nog niet bekend was) nog "slechts" 492,9 MWp resp. 21.273 installaties.
Totaal in zeven maanden tijd 5.664 MWp (174.230 installaties) nieuw aangemeld, een factor 77 maal de geaccumuleerde capaciteit die Nederland sinds eind negentiger jaren heeft gerealiseerd tm. 2010. Dit betekende al tijdens de publicatie van de augustus data voor 2010 onherroepelijk dat de hoogste, in de EEG Novelle 2010 omschreven, kunstmatig vastgestelde "groeicorridor" met de vingers in de neus was bereikt. Want daarvoor gold als "meettraject" de wettelijk vastgelegde periode juni tot en met september van dit jaar. Daarbij werd als "jaarlijkse bijbouw" voor 2010 uitgegaan van het nieuwe volume in die vier maanden maal factor 3. De destijds voorlopig bekend geworden (inmiddels tot 3.790 MWp bijgestelde) 3.628 MWp in die periode gaf een - uiteraard volstrekt kunstmatig bepaalde - "jaargroei" van een absurde 14.512 MWp, wat meer dan het dubbele was van de hoogste vastgestelde 6.500 MWp grens. Dit betekende onherroepelijk wederom een extra forse degressie van 13% per 1 januari 2011 (alleen voor nieuwe installaties), bovenop de reeds forse degressies die al per 1 januari 2009, 1 januari 2010, 1 juli 2010, en 1 oktober 2010 zijn doorgevoerd. Dit werd in deze pdf van 22 oktober 2010 reeds door het Bundesnetzagentur "volgens de letter van de Wet" geformaliseerd.
Dat alles betekent dat, uitgaande van een invoedings-tarief van 33,03 eurocent/kWh voor installaties tm. 30 kWp per 1 oktober 2010 (tabel), met name de particuliere huishoudens met aankoop plannen voor een (meestal) dakvullend PV-systeem, vanaf 1 januari 2011 rekening moeten gaan houden met een wettelijk vastgelegde Einspeise Vergütung van 33,03 - (0,13*33,03) = 28,74 Eurocent/kWh, 20+ jaar lang. Dat begint al aardig in de buurt te komen van de consumentenprijs voor elektriciteit (grofweg 20-21 cent/kWh in Duitsland en stijgend; in Nederland iets hoger, ook sterk afhankelijk van contract). Voor 1 juli 2011 zijn alweer nieuwe, marktgroei afhankelijke degressies aangekondigd, nota bene in samenspraak tussen brancheorganisatie BSW en het voor het EEG verantwoordelijke Duitse milieuministerie (BMU).
Duitsland zette er volgens deze deels al gereviseerde, deels voorlopige cijfers in heel 2010 een spectaculair wereld record volume van 7,41 GWp bij (meer specifiek: 7.408.279,367 kWp), bestaande uit bijna een kwart miljoen nieuwe PV-installaties...
Update: November 2010. Het Duitse milieuministerie BMU publiceerde nieuwe productie data voor 2009 in een september review (Duitstalige brochure hier te downloaden). In die revisie staan ook de eerste resultaten voor het eerste halfjaar van 2010 in vergelijking met dat van 2009 (voorlopige data, pagina 7 van de brochure). Het meest opvallend zijn de volgende data:
Update: March 2011 - December 2010 data published March 21, 2011, by Bundesnetzagentur (BNA), revisions from previous months (published October 21, 2010, and added to this the well-hidden revision for September 2010, published on December 23, 2010), including the data for December 2010:
* World record in one month time, breaking the previous 1.461 MWp record by far (December 2009, also in Germany). December 2010, with its new capacity, has become the third-busiest month since BNA started publishing monthly updates as of January 1, 2009.
** In my previous calculation (when I was not yet aware of the new September 2010 update) the original data for September 2010 were 492,9 MWp, and 21.273 new installations, respectively.
In total, in these seven months only, 5.664 MWp (174.230 installations) were reported new in Germany, a factor 77 times the accumulated capacity that has been connected to the grid in the Netherlands since the nineties of the previous century. This leads to the highest "growth corridor" as fixed in the EEG Novelle 2010 text for Germany. That dictates that the new capacity reported in the months June up till September 2010 should be multiplied by a factor three to obtain the (artificial) yearly market growth in 2010. The original growth data reported in these four months led to a "calculated year growth" of an astonishing 14.512 MWp, which was over twice the size of the maximum growth corridor of 6.500 MWp in the EEG Novelle 2010 Law text. This has resulted in another strong degression of 13% per January 1, 2011 (for new installations only). This, on top of the already strong series of degressions per January 1, 2009, January 1, 2010, July 1, 2010, and, finally, October 1, 2010. This has already been formalized in this pdf dated October 22, 2010 by Bundesnetzagentur "according to the letter of the (revised) EEG Law".
This meant that, taking the original feed-in tariff of 33,03 Eurocent/kWh for installations up till 30 kWp (as of October 1) as a starting point, in particular the many German private households with plans to buy a (mostly roof-filling) PV-system as of January 1, 2011 will have to calculate with an "Einspeise Vergütung" (feed-in tariff) of 33,03 - (0,13*33,03) = 28,74 Eurocent/kWh, for 20+ years. That is not far away from the consumer price for electricity in Germany (various taxes, net costs and EEG Umlage included), approximately 20-21 Eurocent/kWh and moving upwards (in the Netherlands slightly higher kWh tariffs, strongly depending on contract conditions).
According to the preliminary, partially revised data published by Bundesnetzagentur Germany added a spectacular volume of 7,41 GWp in 2010, consisting of almost a quarter of a million new PV-installations...
For use of graphs, please contact webmaster of Polder PV. On this webpage, English explanations can be found directly below the graphs.
Update: November 2010. The Environment Ministry BMU published new production data for 2009 in a September review (German brochure can be downloaded here). In that review also the first results for the first half year of 2010 have been published (preliminary data, page 7 of the brochure). Most striking are the following data:
Important! Note that in all the graphs and captions on this web-page the "European" type of decimal/comma separation is being used. Hence, "2.000" reads as "two-thousand" (alternatively used anglosaxon notation: "2,000"). "7,25 kWp" reads as "seven point twenty-five kWp" (= 7.250 Wattpeak; anglosaxon notation: "7.25 kWp" or "7,250 Wp")! See also discussion on Wikipedia "Decimal Separator" (Polder PV never has used the "space" in long numbers, hence not "2 000 000", but "2.000.000" to indicate two million or 2 times ten power 6, 2 "mega").
Units to remember:
BNA
De cijfers voor de progressie in bij het Bundesnetzagentur aangemelde
zonnestroom capaciteit (MWp) voor 2010 (een verplichting
sinds de EEG Novelle tot geldige Wet werd op 1 januari 2009, om aanspraak
op de wettelijke invoedingstarieven te kunnen maken) worden een stuk sneller
gepubliceerd dan die voor het eerste "verplichte" jaar, 2009.
Het gaat om omvangrijke spreadsheets van enkele megabytes met vele tienduizenden
entries waar mogelijk (deels) nog steeds fouten (dubbeltellingen
of wellicht netaansluitings-meldingen die per ongeluk niet in de gepubliceerde
lijsten voorkomen) in zitten. Dit laatste blijkt gezien de correcties
van BNA (EEG-Statistik rapport 2009) behoorlijk mee te vallen voor dat
jaar.
De grafieken op deze pagina zijn voor het grootste deel gebaseerd op de reeds gepubliceerde niet-definitieve, of reeds al gecorrigeerde lijsten van het BNA. Indien er gecorrigeerde jaar rapportages met nieuwe cijfers komen, zullen deze worden verwerkt als daar tijd toe gevonden kan worden.
Ter informatie van Polder PV's Engelstalige lezers is de rest van de tekst in de Engelse taal gesteld.
 |
^^^ Germany is the place to be if you love solar electricity, or if you want to invest your well-earned money in a future-oriented, safe and sustainable venture. Many people, organisations, and companies fill their roofs and participate in the decentralized energy revolution in an unprecedented and widespread manner. With hundreds of thousands of participants (BSW Solar branche organisation claimed around 840.000 installations in a January 2011 update on their website). Photo taken during the 5-day, 610 km. long "Mega-PV Bayern III" sustainable bicycle tour between Regensburg and München, by the webmaster of Polder PV. |
Revision of previous data published by Bundesnetzagentur (October 21, 2010 and later revisions)
At the same time that the September 2010 data were published for the first time by BNA, they also put revisions of previously published month reports on their website. The data for January 2009 (start of BNA registrations for PV-installations) up till September 2009 have remained unchanged. But as of October 2009, almost all previous monthly data were revised in that publication. The changes originally were not huge, and had only a slight impact on total volumes and capacities realised. Starting with the September 2010 revision, however, considerable volume has been added to the original registrations. In addition, later revisions of earlier published data will probably appear. The changes with respect to the original publications can be seen in the graphs pictured below, made by Polder PV from the revised BNA data known at the date of the present update.
![]()
Absolute changes in monthly data for registered PV installation numbers and accumulated capacity per month in the October 21, 2010 reports and following revisions. With respect to numbers, the biggest change originally was evident for record month June 2010, with 354 installations less than in the original report (refer to right Y-axis and orange columns). Looking at total capacity, columns in blue, in the same month 17,2 MWp disappeared from the original BNA records (left Y-axis). On the other hand, an increase of 10,3 MWp was recorded for May 2010: 294 new installations.
With the September 2010 revision, however, new dimensions had to be considered for this graph. Capacity has been changed from 492,9 MWp up to a new amount of 654,4 MWp, a staggering increase of 161,5 MWp (almost 33%)! For installations, increase was a formidable 6.570 new installations not previously published by BNA (number rising from 21.273 up till 27.843). The reason for these huge differences is not known.
The same graph as depicted above, but now relative changes are shown in percentage of the new or omitted installations with respect to the previous recorded data for installation numbers (orange columns), and total MWp capacities recorded by BNA (blue columns). Note that not more than 1-2% deviation had been recorded in the new datasets for the reported volumes up till August 2010. The overall picture was that only 0,1% change with respect to total volumes and capacities newly added in the period 2009-2010 resulted from the revised BNA data.
This has changed dramatically with the revised September 2010 data: the new report revealed an enormous increase of up till 33% for capacity, and 31% for number of installations. Taking all changes from the revised data together, total capacity rose from 11,06 GWp up till 11,21 for the years 2009-2010 (a difference of 1,4%). 6.340 new installations were reported in the revisions in that period (6.372 new in 2010, 32 installations less in 2009). It is expected that more revisions will be published by BNA.
Graphs made from BNA data/Grafieken gemaakt van BNA data. UPDATE: December 2010 (including revision of previous data)
Basic spreadsheet Dec. 2010 date-stamped March 10, 2011 (published March 21, 2011).
All raw data
in this section from Bundesnetzagentur (FRG) unless stated otherwise.
Graphs made by Peter J. Segaar/Polder
PV, Leiden (Netherlands).
New capacity
per month
Nieuwe capaciteit per maand
Graph BNA 1 - Newly added nominal photovoltaic (DC) capacity per month (MWp, left Y-axis) in Germany in the period 2009-2010 (up till Dec. 2010, including earlier published month revisions up till September 2010). Growth has been absolutely unprecedented, even after the post December 2009 frenzy due to feed-in tariffs sinking 8-11% from the first of January 2010. Year accumulation from January up till December 2009 has been 3.802 MWp according to the revised BNA data, Photon reported even 3.867 MWp in their September 2010 overview in their calculations. For 2010, in the first quarter (January up till March) an astonishing new volume of 717 Mp of new capacity had already been reported to BNA, much more than the "meagre" 74 MWp in 2009, and despite a temporary "dip" in freezing February. Following months showed even stronger volumes. However, it is evident that June 2010 is the new "outlier" with its enormous 2.109 MWp, although with the extreme dynamics in the German market even that record might not live for long. In September 2010 the downgoing "post June boom" trend again reversed, with a - revised - 654 MWp new capacity on-line prior to the October 1 extra 3% degression step. October and November showed however smaller new capacities, although 341-360 MWp in one month time remains a "respectable volume". Even for Germany. December 2010 again showed considerable new volume of 1.174 MWp, although probably less than expected.
Big
PV-installations
The impact on total installed capacity of PV-installations is partially
the result of many large solar power plants of 100-1.000 MWp or even larger
being reported. For example, the biggest installation reported for March
2010 was a 7.120,5 kWp system in the northern Bavarian village of Allmannshofen.
A village hat should already have two solar parcs built (see pdf
of the community) with First Solar CdTe modules installed by juwi. As
of yet it is not known if this 7,1 MWp installation is an addition to
the 15.095 kWp Allmannshofen system reported in the "Bilderbuch"
by juwi (page 20 of pdf),
or that it is part of that 15,1 MWp parc.
April 2010 saw its biggest new solar parc appear in Wertheim along the Main on the northern fringes of Baden-Württemberg, with 6.881,6 MWp. Another village in the same, south-western German state, Ahorn, saw the biggest May installation, with 6.547,9 kWp nominal capacity. In May, 22 new > 1 MWp installations saw fresh sunlight on their modules (Note: two new ones > 1 MWp added in the Oct. 21, 2010 revision, but one reported earlier removed from the May 2010 update).
June brought an astonishing 2.374 new PV-installations larger than 100 kWp in the revised BNA listing, 24 systems less than originally published. 149 of them over 1 MWp (one dropped out), and 10 of the latter category more than 5 MWp a piece. The biggest one: 15,8 MWp in Geroldshausen in Photovoltaics World Champion Bavaria.
After that record June, the second half of the year started with July introducting 792 new installations larger than 100 kWp (13 PV-systems less than in the original list). The biggest one this time a 5,6 MWp PV-system in Bitburg in Rheinland-Pfalz.
August saw "only" 387 big installations >100 kWp a piece (losing 3), with a 18,7 MWp project in Thüngen representing the top of the list, again in Bavaria.
September, with very strong growing numbers again (in particular evident from the revision date-stamped Dec. 23, 2010), revealed 655 new installations above 100 kWp, with 21 power plants bigger than 1 MWp and a 22,7 MWp system as the créme de la créme of this month, in Kloster Lehnin in the east-German Bundesland Brandenburg.
In October 2010, 357 new entries >100 kWp were reported, 33 of them >1 MWp, and two with a size of more than 5 MWp. One entry had a nominal capacity of 5,33 MWp in Köthen. A village already famous for its 14,75 MWp plant by juwi, and the 45 MWp solar power plant with BP modules, started by RGE Energy in August 2009, but the status of which has been unknown for a long time (see article by Polder PV). Suddenly, in January 2011 a press release appeared, reporting on the official opening of "only" 22 MWp of that big project (Polder PV reported on Jan. 22, 2011). In October 2010, a 6,3 MWp plant in the Eastern Bavarian village of Osterhofen has also been included. It is not very far from the huge 55 MWp (51 + 4) PV mega project in nearby Straßkirchen.
The November 2010 report by BNA saw 274 installations (entries) with a size over 100 kWp, including 31 over 1.000 kWp, and 4 gigants >5 MWp. These are: a 5,46 MWp plant (or entry) for Mühlhausen in Bavaria (possibly the same as where the famous single-tracked 6,4 MWp Solarfonds Bavaria portion is located, there are however more "Mühlhausen's" in Bavaria). A 6,22 MWp plant in Steinheim in Baden-Württemberg, and a 13,31 MWp solar parc (section?) in Kloster Lehnin, south-west of Potsdam in east-German Brandenburg. Most probably a First Solar thin-film project by Beck Energy on the premises of the Reckahn area. The most spectacular one, is, however, a 25.462,25 kWp sized solar parc in Tutow in the north of the Poland-bordering east-German state of Mecklenburg-Vorpommern, and enlisted in the BNA data as one single installation. It is a huge extension to the 6,8 MWp thin-film project ("Tutow 1") already realised by juwi in 2009 (project page), and in which juwi renewable IPP will have a 10% stake (this communication). It is, however, not the largest "single entry" in the BNA listings - that remains a 50,99 MWp big chunk of the core-project of Straßkirchen in Bavaria (entry of November 20, 2009).
Finally, December 2010 brought a huge number of large new PV-installations, which is the result of the directives incorporated in the EEG 2010 Novelle that free-field installations having obtained a building permission as late as March 25, 2010 could apply for the pre-July 1, 2010 tariff if the installations were technically connected to the grid as late as December 31, 2010. This has resulted in a considerable number of large installations that were reported to BNA in this last month of the year. The 100 up till 1.000 kWp installation category was well represented with 1.156 entries (although December 2009 and June 2010 saw more in this category). 127 installations sized between 1 and 5 MWp were reported (only June 2010 had more, 139). And a so far unprecedented 21 entries with a system size larger than 5 MWp. The largest installation (or: registered entry) reported in December 2010 was a 18,467 MWp free-field system in Brandenburg. 6 "Länder" had one or more of these >5 MWp monsters and/or segments of even larger parcs registered with BNA: Sachsen-Anhalt had 7, Brandenburg 6, Bayern (Bavaria) 5, and one each for Sachsen, Baden-Württemberg, and Schleswig-Holstein.
Medium-sized
installations
For a true democratic type of decentralized electricity production, the
market segment up till 10 kWp is possibly the most important one, in particular
the installation size up till 5 kWp. A few hundred thousand German households
have already taken the important step to bring solar panels on their roofs
and become an active participant in, and co-carrier of the decentralized
renewable energy revolution. Besides, they represent the backbone of the
political force that is necessary to break the immense power of the monopolistic
energy companies. In the period January up till December 2010, 28.054
new installations with a size of 1-5 kWp were reported (including revised
data, 11,2% of total installations). In addition, 78.682 PV-systems in
the range >5-10 kWp were recorded (31,5% of total, installations 1-10
kWp include 42,7% of all PV-systems in that year). The industry must provide
the means and the price to be able to sell as many of these systems as
possible, in particular because the EEG Umlage (fee on the electricity
price paid by almost all users) included in the kWh tariff already has
risen from 2,047 up till 3,53
Eurocent/kWh as of January 1, 2011, and may rise further. That may
become a political liability if people "are made to believe"
that would be an unacceptable financial burden, if they are not informed
well on the huge financial compensations that the brilliantly designed
EEG system have brought to Germany.
Small
installations
The
smallest installation in the April update is a 185 Wattpeak "system",
possibly one module (???) in Weilheim in Bayern, in May it was a 100 Wattpeak
"system" in the appropriately named village Sternenfels (Baden-Württemberg
again). These are, however, not the smallest systems reported to the BNA
this year. In the February update, an unbelievable "one Wattpeak
system" ("0,001 kWp installierte Nennleistung") has been
reported to BNA from the village of Kratzeburg in the East-German Bundesland
Mecklenburg-Vorpommern. Another (Thyrnau, Bavaria) could be found in the
August 2010 Excel sheet. And also in the November 2010 listing, another
"0,001 kWp" entry was shown for the Bavarian village Hipoltstein.
This again raises some serious doubts about at least some of the data
found in these fascinating BNA reports, since I do not know of any "one-watt
inverter" able to convert the production of that microscopic nominal
capacity into measurable grid AC electricity (for which the EEG system
has been designed). In 2010 298 of such PV-dwarfs with nominal capacities
up till one kWp were reported by BNA (total capacity of these microscopic
installations: 177,4 kWp)...
Accumulation
of capacity per Bundesland 2010
Accumulatie capaciteit per Bundesland 2010
CLICK on
graph for enlargement
X-axis: MWp accumulated per Bundesland in 2010.
Capacity given in number is the cumulative capacity newly installed since
Jan, 1 2010 per Bundesland.
Graph BNA 2 - Accumulation of new 2010 PV-capacity in Germany split into the contributions of the different Bundesländer (the so-called city states of Berlin, Bremen and Hamburg included). Each month has been given its own colour code. Constant strong growth in the sunny 2 southern states, in particular Bavaria/Bayern. Accumulation Jan.-Dec. 2010: a hefty 2.427,0 MWp (already jumping the 2 GWp barrier in 11 months...), is apparent for the southernmost state of Germany adjacent to the Alps. Baden-Württemberg follows at great distance ("only" 41% of accumulation in Bavaria) with 1.005,9 MWp. Nordrhein-Westfalen and rapidly growing Niedersachsen follow suit with new volumes of 901,2 MWp and 796,8 MWp, respectively. Total new capacity registered for Germany in 2010 accumulated to a staggering 7.408,3 MWp...
Monthly
capacity growth differences 2009-2010
Verschil groei maandcapaciteit 2009-2010
Graph BNA 3 - Accumulation of new PV-capacity reported to BNA for eacht month of 2009 and 2010 (left and right columns of each pair, respectively). The columns represent stacks of 10 installation categories (unity: kWp) distinguished by Polder PV, as extracted from the rough (revised) BNA data. In 2009 the market started very slow, with "moderate" capacity reported being connected to the grid (339,5 MWp in total for the first 5 months). In the same period of 2010, however, in which in particular January and February were snow-rich and with severe frost, considerable bigger volumes were reported as "new installations". Some sources claim that a large portion of the earlier PV-systems could be installations planned to go on-line before the end of 2009, but that turned out to be a too ambitious goal (installation work finished at the beginning of 2010, hence new, lower feed-in tariff). While for March 2010 almost six times as much capacity had been installed as in the same month in 2009, April as well as May 2010 saw almost four times more new capacity than in the same month in the previous year. June 2010 showed incredible, world record growth, incomparable with the tenfold smaller volume increase in June 2009. Clearly a result from the politically-driven new feed-in tariffs valid as per July 1, 2010 ("pre-tariff-change-rush"). Although slightly adjusted (struggle between the two "chambers" in German parliament), but already threatening for months resulting from proposals by the Environment Ministry (BMU, headed by CDU member Röttgen). Many people and companies grabbed their chance, and installed huge quantities of PV-systems just in time before the new tariff structure would become valid. This all in one month time with a volume that rich neigbouring countries can only dream of reaching in many years.
The graph clearly shows the popularity of the 15-30 kWp category (orange; the highest segment of the "first staffel" in the German EEG Law, which includes all installations from 1 Wp up till 30 kWp). Also, the 100-1.000 kWp segment (including installations with a few hundred to a few thousand PV-modules) has grown rapidly (purple in the graphs). October has been the first month that less capacity was added than in that month in 2009 (note: preliminary results). Surprisingly, it was followed by November with the same "negative" trend compared to that month in the previous year. Even December 2010 has not brought the large volumes predicted by some, maybe partially the result of the very frosty conditions and a lot of snow and ice in that month. Still, with a volume of 1.174 MWp of new installations, 275 MWp less than the amount in the same month in 2009, December 2010 cannot be seen as a "lost" month in Germany's solar history.
Accumulation
of number of installations per Bundesland 2010
Accumulatie aantal installaties per Bundesland 2010
CLICK
on graph for enlargement
X-axis: number of new installations accumulated per Bundesland in 2010.
Numbers at the right end
of the bars represent cumulative new installations reported since Jan,
1 2010 per Bundesland.
Graph BNA 4 - Comparable to Graph BNA 2, but again, in this graph with the number of installations reported to BNA split up per Bundesland. The total number of new installations increased to a "respectable" 249.845, only in 2010 (that has been "only" 159.820 in the same period in the previous record year 2009, one and a half times less). Again, Bavaria took the biggest part of the pie with an accumulation of 80.129 new installations, 32,1% of all PV-systems freshly registered in that year...
"Reports of the death of the German solar industry have been greatly exaggerated." Recharge nr. 71(4)/June 4, 2010: p. 8. |
Monthly
installation growth differences 2009-2010
Verschil groei maandelijkse installaties 2009-2010
Graph BNA 5 - Accumulation of the number of new PV installations per month. Comparison of 2009 (left column of each pair) and 2010 (right column of each pair), respectively. Overall growth in 2010 clearly is much stronger than in the previous record year 2009, in particular in the first half year. Exceptions are August, and the final three months October up till December 2010 (note, however that total capacity reported for August still appeared to be larger than in August 2009, see Graph BNA3). In May 2010 24.297 new installations were reported (revised data), as compared to 8.315 in the same month in 2009. An increase of 192%. June was the most spectacular [reported] month in German photovoltaic history (up till now), with 65.062 new installations (revised data), six times as many as in the same month in 2009. With respect to the number of installations, the >5-10 kWp segment clearly is the most popular category closely followed by the >15-30 kWp market segment (highest feed-in tariff top segment). In record month June, both categories appeared to be almost equally popular in this "pre-feed-in-degression" month: 18.419 (>5-10 kWp) and 17.210 (>15-30 kWp) new installations, respectively.
September, having been revised bij BNA in December 2010, is now the third record month in German history, with 27.843 new installations. This can, however, change, if later revisions (in particular for December 2010) will become available.
Total number of installations "dwindled" to 12.459 in November 2010, almost the same as the 12.502 new installations in October 2010. Still, with 415 new PV-systems a day "going strong". December 2010, although notably lower than in 2009, possibly due to the very frosty conditions with lots of snow, still showed 23.862 new installations, or 770 on average each day. Christmas included...
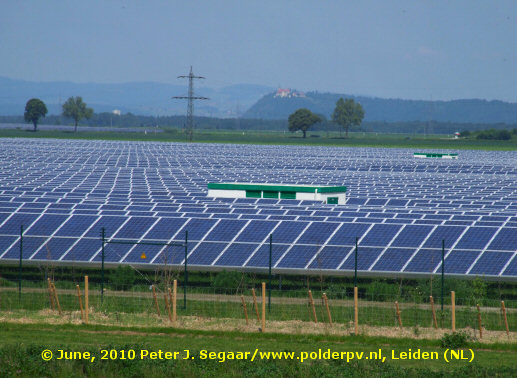 |
^^^ Installation details according to Krinner, the foundation provider/builder with its headquarters nearby: 54,5 MWp** total installed capacity, ca. 51.700 foundation screws, ca. 243.900 multicrystalline modules (average "size" app. 223 Wp), specially made using cells from Thalheim (Sachsen-Anhalt) based Q-Cells (modules made in China). The famous cell company that lost a serious amount of money in 2009, and that has undertaken drastic reorganisation measures to make the business profitable and future-resistent again. At least part of the parc has smaller SMA string inverters (as witnessed by the webmaster of Polder PV), but a big part of the huge power plant appears to have large inverter stations (Xantrex, daughter company of Schneider Electric). Construction period of this monster parc: approximately 3 months. Photo taken during the 5-day, 610 km. long "Mega-PV Bayern III" sustainable bicycle tour by the webmaster of Polder PV between Regensburg and München, visiting several MWp solar parcs and passing an uncountable amount of solar modules on his way through the beautiful Bavarian landscape. Of course, PV-modules, wind turbines and biogas installations, all are an organic and sustainable part of that modern state north of the Alps in the south of Germany. *
With that size, it was already 1,5 MWp larger than juwi's 53
MWp Lieberose parc delivered end of 2009, in east-German Brandenburg...
© 2010 Peter J. Segaar/Polder PV |
Growth
per installation category 2010
Groei per installatie categorie 2010
Graph BNA 6 - Status December 2010. Number of installations per selected installation size class (kWp) newly registered by BNA in the period January up till December 2010, including revisions, in blue (scale at right Y-axis). In addition, MWp capacity cumulated in the same categories and in the same period (accumulation) in yellow (scale at left Y-axis). As usual, the 5-10 kWp installation size segment is most popular with 78.682 new installations in 12 months time. Followed by the 15-30 kWp market segment, the "premium" part of the highest feed-in tariff category (0-30 kWp), with 60.256 installations in that period. However, when it comes to impact on total new capacity installed, the balance clearly lies in the right half of this graph. Most popular with respect to total MWp installed appears to be the 100 kWp up till 1 MWp market segment, with a staggering volume of 1,67 GWp. Despite the fact that the next popular segment is the category 15-30 kWp (with 1,41 GWp accumulated), it is clear that the larger PV-installations claim the biggest part of the MWp volume newly installed: the categories >30 kWp (including the "hors categorie" section with very large free-field installations of many MWp a piece) claim almost 4,79 GWp of total newly installed capacity in 2010 (7,41 GWp), or almost 65% of the market volume.
As already signalled with red flags (1) by Solarenergie-Förderverein from Aachen (SFV), with reference to the February 2010 report by BNA, the typical "small-house" category of 1-5 kWp, an important segment including millions of households, is strongly under-represented. It has only 27.756 new installations (on average "only" 76 of such small PV-systems per day in the well-developed German solar market) and an accumulated capacity of 105,4 MWp in 2010 (note, however, that this volume already exceeds the total accumulation of all "known" PV installations estimated for neighbouring Netherlands by far - roughly between 75 and 80 MWp grid-connected). The next market segment for larger private roofs (>5-10 kWp) is much more popular, with 78.682 installations and a significant, although still relatively small market volume of almost 583 MWp (7,9% of total MWp volume accumulated in this year).
 |
^^^ Photo © Polder PV, taken at the start of Mega PV Radtour Bayern III, a long multi-day cycle tour in the beautiful Bavarian landscape filled with many photovoltaic surprises, June 2010 (Regensburg to München). |
Numbers
and average system size per Bundesland 2010
Aantallen en gemiddelde systeemgrootte per Bundesland 2010
Graph BNA 7 - January - December 2010 graph summarizing accumulation of new installations per Bundesland in green columns (left Y-axis), and the average installation size in that period, in "empty" columns with red margins (right Y-axis). In particular the average system size can vary considerably, strongly depending on the activity with large free-field installations in the Bundesland under consideration. One such PV monster (and/or many larger roof-installations) reported to the BNA can lift the system average in that region considerably in a particular month. The next month that system average might drop again as no new large systems are reported. This graph shows the average in the whole year.
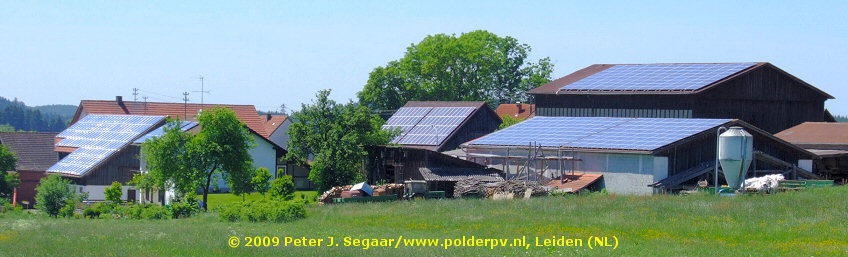
Activity with large and middle-sized PV-installations is particularly striking in the East German states such as Brandenburg actively pursuing large PV-plants, the East-German Bundesland of Mecklenburg-Vorpommern bordering the "Ostsee" and Poland, and the East German Bundesland Sachsen-Anhalt. Mecklenburg-Vorpommern even temporarily took the lead in the November update because the huge Tutow extension in the north-east (old Demmin military airfield) was introduced in that month: 25,46 MWp added in one single installation. In the West-German Schleswig-Holstein region bordering two sunny coast-lines ("Ostsee" & "Nordsee") and Denmark, many farmers have started to install PV-arrays on their huge barns, stimulating a high system average in this region with few large cities. In most of these regions with high system average, relatively few installations have been realised. Of course, the number of new installations remains highest in Bavaria, with 80.129 in 2010 (on average 220 each day, twelve months on a row...).
Average
system size per category 2010
Gemiddelde systeemgrootte
per categorie 2010
Graph BNA 8 - Average installation capacity per category split by Polder PV for the new installations accumulated in 2010. Overall average accumulated system size reached a level of 29,65 kWp in this month (moving average, last column). This is considerably higher (25%) than the average new installation size in 2009, 23,79 kWp. The > 5.000 kWp category had an incredible amount of 49 large installations known by Bundesnetzagentur this year. Note that "installations" can also mean PV-system claims. In particular larger free-field PV-systems are often realised and reported to BNA in smaller, albeit still large fractions.
Growth
per month 2009-2010
Groei per maand 2009-2010
Graph BNA 9 - Changes from month to month in a comparison of 2010 with respect to (monthly) growth in the previous record year 2009. The comparisons have been made for 3 data: new capacity (MWp) installed in the month under consideration (light blue, left of each triple column), new number of installations per month (blue, the middle one of each triple column), and average system size newly installed in that month (dark blue, right of each triple column). Growth 2009 > 2010 has been given in percentage of the growth volume (newly installed capacity, installation numbers or average) in 2009. In particular January 2010 had a very big impact with respect to the growth in the same month a year before. February also showed considerable differences. Although the differences slackened as of March, initially all monthly growth marks for 2010 far outpaced the ones for record year 2009 in the first half of 2010, with differences of a few hundreds of percent.
June 2010, of course, brought a suprise because of the threatening EEG Novelle 2010 feed-in degressions: Installation numbers and capacities soared in that [widely perceived] "last chance month", resulting in growth rates compared to the "relative tranquil" June 2009 in hundreds of percents. "Outliers" appeared to be the installation numbers in (a) the summer month August 2010, that saw almost 19% less installations than in August 2009. However, total installed new capacity in August 2010 turned out to be 25% more than in the same month one year earlier (average new system size even 54% more). Secondly (b), the "post October 1 [3% extra] degression slump" in October revealed slight decrease in installations. (c) The third, most striking "loser" was November 2010 with almost 29% less installations and even over 44% less capacity added as compared to November 2009. However, this might also be seen as a signal of a quiet before a small new storm. (d) While December indeed brought the third "shockwave" over Germany, it was not so strong as expected and was even considerably less strong than the same month a year before: 19% less new capacity, and over 43% fewer installations. However, due to the many large installations reported in that final month, system average soared in that month, even much bigger than in December 2009 (43% higher). It is expected that further changes may come when revisions of preliminary month data will become available on the website of BNA.
The last columns ("Total/av.") give the growth percentages 2009 > 2010 for the total accumulation values for the first two data, or the growth of the average for the system size up till that month. These average growth numbers are all staggering, ranging from 95% for capacity added, 56% for number of installations, and 52% for average new installation size, respectively.
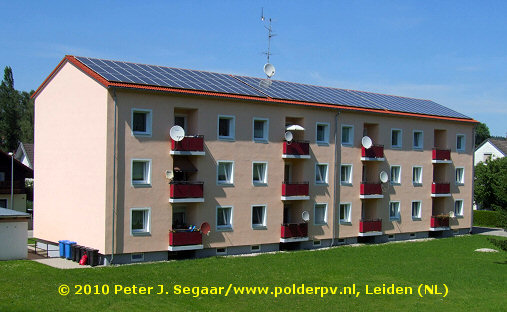 |
^^^ Zonnepanelen op appartementencomplexen ingewikkeld?* Niet in Duitsland. De eigenaar kan gewoon de hele installatie aan laten sluiten op één Einspeisemeter die in zijn/haar eigendom kan zijn, en door een gecertificeerd installateur wordt de hele installatie gewoon direct op het laagspanningsnet aangesloten. De lokale netbeheerder dient vervolgens maandelijks (of bij overeenkomst met de decentrale producent: jaarlijks) de wettelijk verplichte Einspeise Vergütungen uit te betalen zonder vertragingstactieken. Simple as that: zo word je wereldkampioen implementatie. Als dit specifieke PV-systeem voor 1 juli in 2010 aangesloten had geweest had het waarschijnlijk, gezien de grootte**, aanspraak kunnen maken op 20 jaar lang invoeding ter waarde van 39,14 eurocent/kWh. Flat in Simbach am Inn aan de zuidrand van oostelijk Bayern. Ik kwam daar net via de brug uit Braunau am Inn aan de overzijde, Oostenrijk, waar ik in het korte stukje dat ik daar fietste geen een PV-paneel heb gezien. Echter, zodra ik de Inn langs reed aan de Duitse noordoever van die brede rivier, was het weer "Blau, Blau, Himmelsblau". En niet alleen in de lucht, maar vooral ook: op de daken... *
Zie
bespreking
Ymere project Energieker op 27 juni 2010. Foto © Polder PV, genomen tijdens Mega PV Radtour Bayern III, juni 2010 (Regensburg - München). |
Progressive
development of Germany's PV market in 2010
Progressieve ontwikkeling van de PV-markt in Duitsland in 2010
Graph BNA 10A - Progressive development of installed capacity of photovoltaic installations in Germany in 2010, extracted from the (revised) month reports published by Bundesnetzagentur. In green columns the new capacity per month in MWp (refer to left Y-axis for scale). In yellow with red numbers the accumulation of newly installed PV-capacity reported to BNA as of January 1, 2010 (refer to right Y-axis for scale). In December a staggering 7,41 GWp had accumulated, a new world record for one year. June saw a world record new installation capacity of 2,11 GWp. Just before the long-awaited drastic feed-in tariff reductions would materialise (EEG Novelle 2010, implemented effectively as of July 1, 2010). That record could also be described as: each day in June an average new capacity was added in the order of 70 MWp (each day in June an equivalent of almost the total accumulation in neighbouring Netherlands added in Germany).
CLICK
on graph for enlargement
Graph BNA 10B - Figure comparable to previous graph, this time showing progressive development of number of photovoltaic installations in Germany in 2010. In green absolute new numbers per month (refer to left Y-axis for scale), in yellow, with red numbers, the accumulation of these data as of January 1, 2010. 65.062 new installations were added in record month June (revised data), which means that on average 2.170 PV-systems were reported each day at the Bundesnetzagentur office in that month. Or that their administration has been assigned as such (BNA publishes the results with a date stamp for each installation, in general, on weekend days there are none or few entries). Although numbers dropped off considerably in July and August (both holiday months), the level at which installations are reported to BNA remained high and increased again strongly in pre-1-October-degression September (27.843 new installations). October and November 2010 saw relatively "little" growth with 12.502 and 12.459 new installations. December again generated good growth despite freezing conditions in snowy landscapes: 23.862 new installations were added (on average 770 per day, Christmas included), many large ones among them. Accumulation for the end of year (December) amounted to a large number of 249.845 PV-installations producing decentralized renewable electricity. On average that means that in 2010, each day 685 brand-new PV-installations (and/or big fractions of large MWp parks) were registered by the BNA office...
 |
^^^ Regrettably, after long discussions and hot debates, German parliament decided that these so-called "free-field [FF] installations" are not allowed anymore when planned on agricultural land as of January 1, 2011 (effectively for planned PV-installations not having acquired a building permit in time: as of July 1, 2010). In other words: these type of (new) installations have been wiped from the EEG incentive regime (only FF installations on "conversion" terrains, restructuring areas, etc., can claim feed-in tariffs under the adjusted EEG 2010 Novelle). This will certainly put a brake on the progressive realisation of new capacities, and this questionable, politically motivated change discourages technological innovation and further cost reduction in the research field of this kind of large PV-installations. The "cheapest" of all PV-systems, if €/Wp system cost price and value of €/kWh produced is considered. Photograph
© 2009 Peter J. Segaar/Polder
PV |
Quarterly
reports 2009-2010
Kwartaal overzichten 2009-2010
Please note: quarterly overviews will be refreshed only as results of all months in the quarter considered have been published by Bundesnetzagentur. Next update is expected as soon as March 2011 results are known (quarter I).
Noot: kwartaal overzichten zullen pas worden ververst als de resultaten van alle maanden in het betreffende kwartaal bekend zijn gemaakt door Bundesnetzagentur. Volgende update dus als resultaten voor maart 2011 zijn gepubliceerd (kwartaal I).
![]()
Graph BNA 11A - New PV-capacity registered by BNA per quarter (revised data up till Sep. 2010), comparison between 2009 (white columns) and 2010 (brown columns). First quarter for 2010 already had 9,7 times more new capacity than reported in 2009. The second quarter had 6,7 times as much new capacity, mainly the result from world record month June with 2,1 GWp of new capacity claimed. In the third quarter, the ratio had dropped to a factor 1,8, due to the expected temporary "slack" in the market after the official start of EEG Novelle 2010 as of July 1 of that year (and despite the tempory rush in September). Contrary to previous thoughts, the final quarter in 2010 did not yield a record. Instead, the preliminary volume newly added was even less than that in 2009 (a year that showed ever more capacity in each new month, in strong contast to 2010). For 2010 as a whole, the "total" new capacity is, of course, much larger than in 2009 (final, dotted column pair): 7.408 MWp instead of the previous (2009) 3.802 MWp. 95% more newly installed capacity. An incredible growth rate, viewing the already huge market in Germany.
Graph BNA 11B - New PV-installation numbers registered by BNA per quarter, comparison between 2009 and 2010. The number of new installations reported in the first quarter of 2010 has been 5,4 times larger than that reported in 2009. In the second quarter the ratio 2010:2009 has been 4,2:1. For comparison: End of June only 4.693 certified PV-installations were registered with the Dutch bureau of CertiQ, only 4.077 of them newly added since April 2008 in a period of time that was 8 times as long as the first quarter of 2010 in which Germany added seven times as many brand-new PV-systems. If one counts the number of new systems added in the first 6 months of 2010 for Germany (140.677), 35 times as many installations were added in the world champion of photovoltaics as the Netherlands did in a period of 27 months time (April 2008 up till June 2010) under the umbrella of an exceptionally bureaucratic and highly capped "incentive" regime (SDE). This, in addition to an almost ten times bigger average installation size in Germany.
The third quarter has been considerably more quiet showing only a factor 1,3:1 with respect to 2009 (and despite the rush in September). The final quarter did even worse than in 2009, in which the ratio 2010:2009 was decreased to 1:0,6. Still, for the whole year, 2010 has nothing to complain about. With almost a quarter of a million new PV-installations it crushed previous record year 2009 bij a factor of more than one and a half in system numbers.
![]()
Graph BNA 11C - Average size of new PV-systems registered by BNA in 2009 and 2010 per quarter. In the first quarter, average installation size has increased considerably from 13,0 kWp in 2009 to 23,4 kWp in 2010. That average rose again to 18,1 kWp per installation in the second quarter of 2009, and even to a level of 28,5 kWp per installation in that period in 2010. Although the third quarter showed further increase of the system average in 2009 (up till 20,5 kWp), it remained stable in that period in 2010, possible reaching a temporary level of "saturation" or a system size that is hard to exceed on the roofs still available in Germany (at this average level: typical for farm roofs). With respect to the latter suggestion, only considerable module efficiency increases might bring further enhancement of average system size (taking into account an average roof surface available that does not change much). In that third quarter, it had already reached a very high level, far exceeding that realised in neighbouring countries (over 4 kWp/system in Flanders, Belgium, some 2-3 kWp/system in Netherlands).
The final quarter brought, however, a new record level of 38,4 kWp per installation, far beyond the 28,1 kWp average reached in the final quarter of 2009. This is mainly the result of many very big installations coming on-line in, particularly, December 2010. It remains to be seen if that high level can be sustained. The number of locations for very big solar power plants will ultimately dwindle in Germany, in particular since the EEG Law has become terra non grata for such installations on former agricultural land (factually as of July 1, 2010).
 |
^^^ |
Both photographs © Polder PV, taken during Mega PV Radtour Bayern II, a multi-day cycle tour between Backnang in Baden-Württemberg and München (Bayern), May 2009.
Graphs with BNA registrations per day and per week
CLICK
on image for enlargement (click twice if necessary)
Graph includes all BNA revisions for data of January up till (and included) September 2010.
Graphs BNA 12A (see also 2 details below) - Registered number of installations and total capacity per day at the Bundesnetzagentur office. All installations have a day-stamp in the Excel files produced by BNA. Clearly, the weekend interruptions can be seen in this graph (no or very little entries on weekend days). For three details of this graph, showing the end of June 2010, end of September, and the December 2010 reporting peaks, see below. All registrations are lined up, starting from January 1, 2009 (beginning of EEG Novelle-dictated registrations at BNA) up till December 2010 at the right of the X-axis. In blue-rimmed columns number of installations with scale on right Y-axis; in yellow filled columns total capacity registered on the day shown in kWp, scale on left Y-axis.
The huge "end of former interesting feed-in regime" rushes are clear even on a daily basis. For the end of 2009 December rush (due to law-derived degression percentages as of Jan. 1, 2010 8-11%) the pre-Christmas-day of December 23 had its record number of installations registered (2.939 entries), as well as with respect to total new capacity: 137,1 MWp on one day. The June 30, 2010 world record (442 MWp in one day) is shown in detail, below. The third degression step in 2010, that of October 1 (3% extra degression for all new installations as of that date) showed only a relativelly low peak at September 30, originally reporting 71,1 MWp by Bundesnetzagentur. However, in the December 23, 2010, update for September 2010, a large new volume was added and many installations, resulting in a considerable peak of 4.783 new installations on that day, with an accumulated volume of 162,3 MWp (128% more than originally published!). Although the volumes for the snow-rich December 2010 month have appeared lower than expected, it is clear that the end of 2010 has revealed a large number of big installations, as shown in the third detail graph further below.
 |
^^^ A considerable number of installations (3.007 in the revised data by BNA) got a date-stamp "July 1, 2010", and will "have to do" with feed-in tariffs that are up till 13% lower than those fixed for 20+ years with the date-stamp "June 30, 2010". On weekend days (e.g., June 5-6, 12-13, etc.) no or very few registrations have materialised in the spreadsheets of BNA. The same applies to some holiday periods (eg., end of the year directly after Christmas and start of the new year, see overview shown above). ©
2010-2011 Peter J. Segaar/www.polderpv.nl |
The "end of June 2010" rush, triggered by the long awaited and hotly debated introduction of "EEG Novelle 2010" promising degression percentages of up till 16% (ultimately, however, materializing in max. 13% as of July 1, and an extra 3% as of October 1), has turned out to break the previous record to small pieces. On the very final day of the "old" tariff period, June 30, 2010, an enormous amount of 10.224 new entries were registered by BNA, with an unprecedented 441,8 MWp of capacity in 24 hours time...
Although the number and size of the registrations have dropped considerably since that record day, a daily growth rate of 500 or even more installations with a capacity of approximately 25 MWp on average (temporarily rising again strongly end of September 2010) would be on every wish-list of any nation respecting itself and its sustainable future.
September 2010 rush (old versus new):
 |
^^^ Total new capacity for September 2010 has been upgraded to 654,4 MWp by BNA, originally that was only 492,9 MWp (a difference of 32,8%!). For installation numbers the difference has been 27.843 (new) instead of 21.273 (old), an increase of 30,9%. Note that in this graph the data shown for October are very likely to change as soon as new, revised data will become available at the website of Bundesnetzagentur. ©
2010-2011 Peter J. Segaar/www.polderpv.nl |
The second detail shows the originally considered "feeble" end of September 2010 rush in more detail. However, new data discovered in an apparent "old" spreadsheet on the BNA website (separate tab "September 2010 aktualisiert") has made crystal clear, that there really has been a serious "end of September run" for reporting new installations to the BNA office. Instead of the originally reported 492,9 MWp, in the new version a much larger volume of 654,4 MWp has been recorded for this month. I emphasized the differences between the original and newer data by using the "rollover image" function that you can use by shifting the mouse pointer over and away from the image.
From this, it is also clear that, because of these huge changes for September 2010 (also in numbers, see figure caption), the preliminary data reported for the later months October up till December will probably also change considerably. In particular the effect for the "End Of Year Rush" month December will be exciting to see.
End of 2010 rush - December:
 |
^^^ Many large installations have been reported in December, as they could apply for the "pre-July 1 feed-in tariff" if they had their building permit in time in March of that year. Many of these large free field installations have been connected to the grid in that last month. Note that data for the last three months of 2010 can still be revised by Bundesnetzagentur (note the considerable effects of such a revision in the September 2010 report). ©
2010-2011 Peter J. Segaar/www.polderpv.nl |
As becomes apparent from the (detail) graphs shown above, the weekend "non-registrations" break up the continuous trend that should be apparent from normal daily entries as would be expected from the many thousands of new owners with PV-installations to report to the BNA office (the procedure is carried out electronically by most people). To circumvent these "weekend holes" in the graphic representations, I summarised for each calender week the total number of entries (and capacities), and subsequently divided the outcome for each week by 7 to construct a new series of graphs with the "average daily entries per calender week" values, and without the "artificial weekend gaps". Three interesting graphs materialised from these calculations, such as given below.
Graph BNA 12B - Absolute number of installations registered by BNA (including revised data as of October 21, 2010) per calender week as of week number 1 in 2009. Four maxima are apparent, as could be expected from the important milestones, the expected (politically motivated) new feed-in degressions. Starting with January 1, 2010 (5th day of calender week 53 of the previous year), the one with the biggest impact on July 1, 2010 (in the middle of calender week 26), the "extra" (actually: "postponed") 3% extra degression on October 1, 2010 (the middle of week 39). And, finally, the end of 2010 rush prior to the new 13% degression as per Jan. 1, 2011. The milestones are indicated with vertical dashed blue lines (= hard transition to a new tariff period for new installations).
The actual week maximum for end of 2009 did not fall in the final week, but in week number 51 (December 14-20, 2009), with a record 11.249 new installations. The amounts recorded in the first calender week of 2010 abruptly sink to a still "interesting" level of 2.043 new entries, five times lower. Again, the final week of the first half year of 2010, week number 26 (actually running from June 28 up till July 4) breaks all records with 29.710 entries. Note that this is not the "7-consecutive-day-record": that has been of course the period June 24-30, with the "true record" of 32.263 new installations.
As of the beginning of September 2010 (app. calender week 35), installation numbers started increasing again up till the 30th of that month, recording 4.783 (prior to Sep. 2010 revision: 1.533) new installations on that final day (162,3 MWp instead of the earlier reported 71,1 MWp), prior to the new 3% degression valid as of October 1, 2010. Week 39 revealed 13.649 (before revision of Sep. 2010 data: 7.693) new installations: the "final policy decisions induced peak" of 2010, before the last one not yet fully known: that of the final days of the year.
The last calender week of 2010 (nr. 52) has not yet been completed: data in the March 21, 2011 BNA update, do not yet include the full calender week on the brink of 2010-2011. The first 5 days including Dec. 31, 2010, already had 7.199 installations, to which the registrations on the first 2 days of January 2011 should be added (not yet published by BNA). That number for the first 5 days was already larger than the 6.424 new installations counted for week 51 (final column in present graph).
From the calculated week data, it was easy to obtain the average values per day for each week. I summarised two of these data in one graph, average number of registrations per day, and the average MWp registered per day for each week:
CLICK
on graph for enlargement
X-axis: Week number 2009-2010, updated up till week 51, December 2010.
Left Y-axis: average number of registered installations per day for
each week (yellow columns); right Y-axis: average installed capacity
per day for each week (in MWp, blue columns).
Graph BNA 12C - Although the graphs for the two values are highly reminiscent, they are not completely synchronous. This is particularly evident if total number of installations in a week is not exceptionally high, and relatively many very large installations have been reported in that week (height of blue column could have bigger impact than that of the yellow column for that week). Especially for the last known week data in 2010, it is apparent that a considerable number of large installations must have been reported, since the blue column for average system size surpasses that for number of installations in that week in the scale used here. It is apparent that many large field installations have been registered with BNA in December 2010 (among them 127 installations with sizes between 1 and 5 MWp, and even 21 larger than 5 MWp).
Note that, in addition to other changed data, the peak for the final week of September 2010 has become considerably higher compared to the values for the unrevised data for that month: the largest peak in week 39 now has 1.950 new installations on average per day (that used to be 1.099 in the unrevised version), and an average new capacity of 52,3 MWp per day (previous, unrevised version: 30,3 MWp). Almost double the previous data.
Finally, I was particularly interested into how the average overall system size developed in the course of time of installation reports entering the BNA statistics. This could easily be obtained from the data calculated for graph 12C:
Graph BNA 12D - X-axis shows year and week number (09-33 = official week number 33 of 2009). As evident from this graph (updated with the revised data for Sep. 2010), average system size per calender week increased rapidly as of the start of 2009, and seemed to stabilise around 20 kWp average per installation (with exceptions in weeks with large free field installations reported). The end of 2009 rush resulted in week number 52 with an individual PV-system average of 42 kWp. For the "end of June 2010 rush", the record value has been less impressive, although with 37 kWp on average in week 26 (including 4 days in "lower feed-in tariff period" July 2010) the Germans can be very satisfied. Note the surprising over 36 kWp average in week 34 of 2010 (August 23-29). This is the result of 10 installations >1 MWp registered in that week, with a total of 38,7 MWp, including two "blocks" in Finsterwalde, Brandenburg (5,6 MWp), a 4,4 MWp PV-system in Fuldatal, Hessen, and, in particular, the 18,7 MWp installation in Thüngen, Bayern. Week nr. 47 (November) also showed a high average, resulting from the inclusion of the Tutow 25,5 MWp plant (Nov. 23rd) as well as the Kloster-Lehnin 13,3 MWp system (Nov. 24th) in that same week.
The expectation that in the last month of the year many more large installations would be registered at the BNA office has turned out to be true: a preliminary new average installation record has already materialized in week 51, with a spectacular average of 58,3 kWp per installation. For December 25 up till 31 (7 days) that system average has even been 59,5 kWp: those final 7 days of the calender year yielded 7.238 new registrations with a total capacity of 430,848 MWp.
(1) Internet newsletter of July 1, 2010, and article with images titled: "Photovoltaik in Deutschland vor dem Absturz." I recommend that article to anyone able to read German who is interested in the possible desastrous (???) consequences of "politically-motivated adjustments of world's most succesfull incentive regime" ever invented for solar electricity. SFV predicted a possible "Vollbremsung" (strong backlash) of the PV-market in Germany once the EEG Novelle 2010 would be effective. Although actual installation numbers and capacities indeed were considerably lower than in the record month June, the numbers for July and August remained staggering. SFV: http://www.sfv.de.
Statistical data:
©
Bundesverband
der Energie- und Wasserwirtschaft (BDEW)
© Bundesnetzagentur
(BNA)
Many studies with overwhelming details, numbers, and graphs, on developments with respect to the implementation of EEG Law and renewables in Germany can be found on the very well documented, unique site "Erneuerbare Energien" by the Ministry of Environment in Germany, BMU:
http://www.erneuerbare-energien.de/inhalt/
Voor de eerste data voor 2010: zie de Februari 2010 update BNA (jan. + feb. : plus 287 MWp nieuw) inclusief het accumulatie record (over de 10 GWp), en het inleidende bericht van 3 juli 2010.
Uitgebreide documentatie over de ontwikkelingen rond het EEG (inclusief zonnestroom) vindt u in de link lijst en referenties naar artikelen op Polder PV op de aparte EEG pagina.
Uitwerking/additional calculations and graph production: Polder PV. Errors and miscalculations are the responsibility of Polder PV. Please notify the webmaster if you find any.
Webpagina
gepubliceerd dd. 6 juli 2010. Updates 18 juli 2010 (april rapport BNA);
19 juli 2010 (lay-out/indeling verbeterd); 26 juli 2010 (mei rapport BNA);
27 juli 2010 (foto Straßkirchen en citaat toegevoegd); 27 oktober
2010 (update met resultaten juni tot en met augustus 2010); 4 november
2010 (update september plus volledige maandrevisie van 21 oktober 2010);
9 januari 2011 (update oktober); 10 februari 2011 (update november); 23
maart 2011 (update december 2010); 26 maart 2011 (update met de gereviseerde
data voor september 2010).
|