|
|
  
Weltmeister
still going strong
Update
October 2012¹
A first insight in Germany's market growth in photovoltaics in 2012
Voorlopige
cijfers ontwikkeling fotovoltaïsche markt en zonnestroom productie
2012 in Duitsland
¹
Based
upon BNA data for January 2009 up till - and including - October 2012
Further
PV-market analyses for Germany:
2012 2011 2010-II
2010-I 2009
2008 2007
def. 2007 cf. BSW 2006
2005
©
Data graph: BMU/AGEE Stat, Bundesnetzagentur (Germany); CBS/StatLine,
CertiQ (NL)
Graph: www.polderpv.nl,
Leiden (NL)
Update
for Germany with all Bundesnetzagentur (BNA) data and revisions included,
up till, and including, October 2012. For year accumulations the most
recent data from the so-called "Zeitreihen"
publication of the German Environment Ministry (BMU) and the AGEE
Statistics group has been taken as basic reference (all years included
as of 1990, update July 2012). Comparison with minute micro-market Netherlands
in red-lined box (same scale, 1 GWp line indicated
but still far beyond reach), including preliminary accumulated capacity
for the year 2011 using the most recently published CBS data, and using
a new calculation of the capacity for the year 2011 by Polder PV (article
November 29, 2012). To that 2011 prognosis the known certified installations
published by CertiQ for January up till August 2012 has been added.
Regrettably, at the start of December 2012 more recent data by CertiQ
were unknown, and capacity growth of non-certified volumes (the largest
part of the market in 2011-2012) remains a mystery until CBS will provide
new data (expectation: not earlier than Spring 2013).
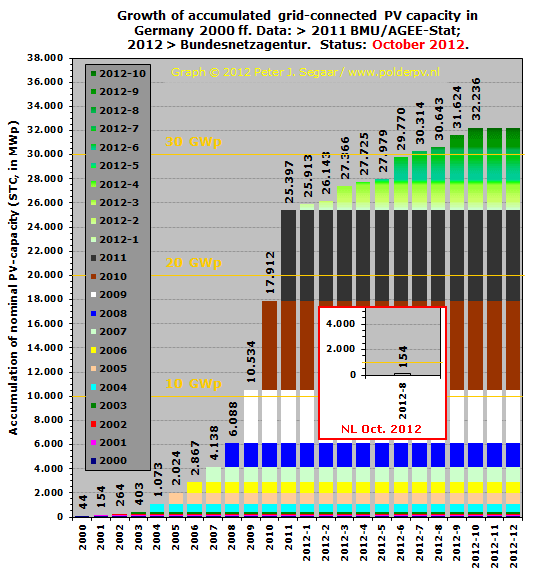
With
all known revisions by Bundesnetzagentur, 2011 saw
a new world record market installation volume of 7.485 MWp*
and almost 239.000 new PV-installations (registered entries in the BNA
spreadsheets, volume shown in dark-gray
column segments). Note, however, that the numbers for earlier years
may still be adjusted in coming reports.
Progress
with Gigawatts
With the new and revised monthly installations, total accumulated
German PV-capacity has broken the 15 GWp barrier in September 2010,
and surpassed 17 GWp end of December of that previous record year. The
20 GWp barrier has been surpassed with the August 2011 data provided
by Bundesnetzagentur. That impressive volume has been reached in a relatively
short time after breaking the "magic" 10 GWp barrier (accumulation
of grid-connected PV-systems) in January or February 2010, depending
on the data source for accumulated MWp level in previous years. 2011
has easily passed 24 GWp of accumulated capacity. In June 2012 already
over 29 GWp has been reached, and finally, the "magical" volume
of 30 GWp has been taken in July 2012.
Small,
red-lined box for Netherlands based on CBS (only once
a year results are being published, 2011 preliminary data became known
only as late as May 31, 2012, slightly revised end of June 2012), but
had to be revised since CBS provided significantly higher electricy
production data for solar on November 26, 2012 (article).
CertiQ data (monthly reports and/or - revised - year reports, certified
capacity only) lag behind for months, which is highly unusual (latest
update: August 2012). From known accumulation data published by CertiQ,
it could be derived that at least 14,9 MWp new certified volume could
have been added in January - August 2012. This brings "accumulated
capacity", known from data in official reports, and own calculations,
at roughly 154 MWp end of August 2012. Less than 0,5% of the accumulated
("all certified") volume in Germany... Note that in NL also
a considerable volume (double-digit MWp) will have to be added that
has not been certified in the first 8 months of 2012. There is no law-embedded
central registration for this majority of new PV-installations in the
Netherlands. Hard numbers are almost impossible to obtain...
Non-certified
installations 2012 are not included in the Dutch number, since data
are not [yet] known. For the most recent "educated guess"
of possible market development in Netherlands in 2012, see
my analysis
of July 9, 2012 (Dutch).
*
Italy connected a larger volume to the grid in 2011 - 9,4 GWp, but 3,7
GWp of that volume had already been installed in 2010, hence not yet
having a net connection (Photon 5/2012)...
Samenvatting
Op deze
pagina de eerste grafieken met cijfers over de realisatie van zonnestroom
vermogen en productie in Duitsland in 2012, volgens cijfers van het BNA
(Bundesnetzagentur), een ambtelijke organisatie onder het Bundeswirtschaftsministerium
("Economische Zaken van Duitsland"). Een groot deel van de opzet
en basis informatie is ontleend aan de zeer gedetailleerde overzichten
van voorgaande jaren en aangepast daar waar recenter cijfermateriaal is
gepubliceerd. Revisies van de maandelijkse bijbouw cijfers van
het BNA zijn voor zover bekend pas tot en met mei 2012 gepubliceerd.
Update
capaciteit: BNA spreadsheets tm. oktober 2012 (update
van 30 november 2012 op hun EEG
statistiek web pagina). In grafieken verwerkt ook de gegevens van
juni tm. december 2011 - de eerste (verder nog niet gereviseerde) officiële
cijfers voor dat jaar. Eerder waren al revisies van de maanden oktober
2010 tm. mei 2011 gepubliceerd met lichte bijstellingen (update 29 juni
2011). Deze wijzigingen zijn allemaal meegenomen in het huidige overzicht.
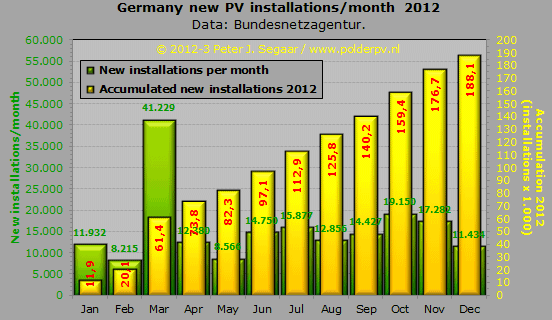
Resultaten vanaf januari 2012:
2012
- Januari
2012: 516,6 MWp, 11.932 nieuwe installaties aangemeld.
- Februari
2012: 229,9 MWp, 8.215 nieuwe installaties aangemeld.
- Maart
2012: 1.222,8 MWp, 41.229 nieuwe installaties aangemeld.
- April
2012: 359,0 MWp, 12.380 nieuwe installaties aangemeld.
- Mei 2012:
254,2 MWp, 8.566 nieuwe installaties aangemeld.
- Juni 2012:
1.790,9 MWp, 14.750 nieuwe installaties aangemeld.
- Juli 2012:
543,2 MWp, 12.077 nieuwe installaties aangemeld.
- Augustus
2012: 329,4 MWp, 12.856 nieuwe installaties aangemeld.
- September
2012: 980,8 MWp, 14.427 nieuwe installaties aangemeld.
- Oktober
2012: 611,9 MWp, 19.150 nieuwe installaties aangemeld.
- Voorlopige
accumulatie januari tm. oktober 2012: 6.839 MWp; 155.582
nieuwe installaties aangemeld tm. oktober 2012 (gemiddelde installatie
grootte: 44,0 kWp, ongeveer 191 PV-modules met een vermogen van 230
Wp).
- Voorlopige
accumulaties 2010 resp. 2011 / jan. tm. okt.: 5.869
resp. 3.843 MWp (groei 1e 10 maanden 2012 16,5% t.o.v. dat in 2010 en
zelfs 78% meer t.o.v. het groei volume in 2011).
- Voorlopige
accumulaties 2010 resp. 2011 / gehele kalenderjaar:
7.378 resp. 7.485 MWp volgens de Bundesnetzagentur opgaves. Echter,
in de herziene "Zeitreihen"
van het Milieu Ministerie (stand: juli 2012) is het volume voor
2010 fors naar beneden bijgesteld, en bedraagt dat inmiddels 17.554
- 10.566 (accumulaties totaal volumes 2010 resp. 2009) = 6.988 MWp,
wat 5,2% minder is dan volgens de gepubliceerde cijfers van Bundesnetzagentur.
Het is niet onmogelijk dat er in 2012 wederom een nieuw bijplaatsings-record
kan worden gevestigd in Duitsland. Daartoe zou er in de 2 laatste nog
zo'n 650 MWp bij moeten komen, 325 MWp per maand. Het maandgemiddelde
voor 2012 was tot en met oktober 684 MWp...
Uit bovenstaande volgt
dat in de eerste tien maanden tijd van 2012 er alweer meer capaciteit
is bijgekomen dan in 2011, en dat er nog best het nodige volume bij zal
kunnen gaan komen. Ondanks alle "harde snoeimaatregelen" van
de autoriteiten om het Erneuerbare Energien Gesetz voor zonnestroom zo
onaantrekkelijk mogelijk te maken. Of, zoals sommige politici het liefst
zouden willen: om het succesverhaal zonnestroom uit het in de loop van
de tijd al zwaar geamendeerde EEG te trappen...
Het grafische
deel van deze webpagina verder in het Engels.
Graphs
made from BNA data/Grafieken gemaakt van BNA data. UPDATE:
October 2012
(including partial revision of previous data)
Last
data added: Bundesnetzagentur spreadsheet October 2012 (Status: November
30, 2012).
All
raw data in this section from Bundesnetzagentur (FRG) unless stated
otherwise.
Graphs made by Peter J. Segaar/Polder
PV, Leiden (Netherlands).
New capacity
per month
CLICK
on graph for enlargement
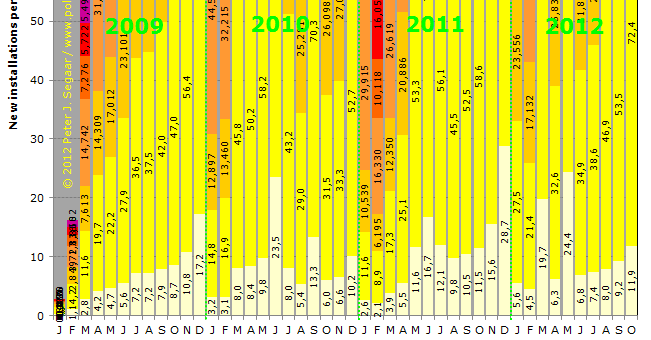
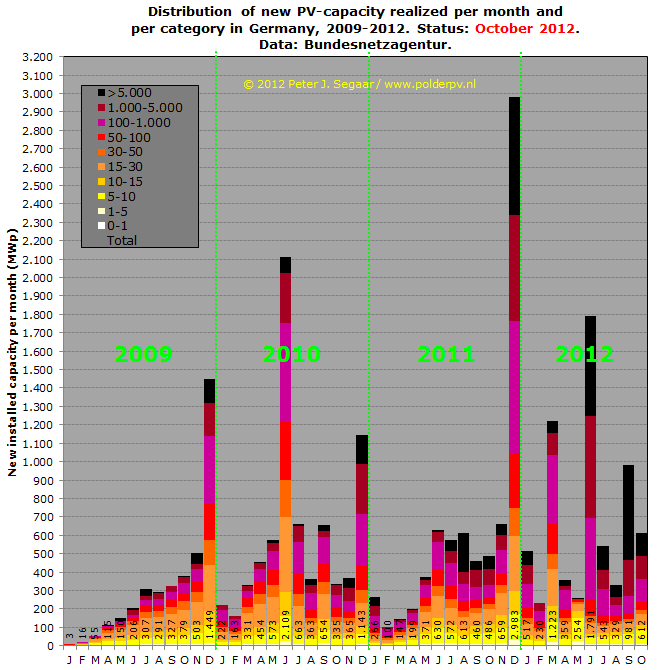
Graph
BNA 1 - Newly added nominal photovoltaic (DC) capacity
per month (MWp, left Y-axis) in Germany in the period
2009-2012 (up till, and included, October 2012, and earlier published
month revisions up till May 2011). Growth has been absolutely unprecedented
for a long time, with only significant low volumes in the winter months
January and February, in which roof and field work mostly is impossible
due to snow and freezing conditions. Year accumulation in 2009 has been
3.802 MWp according to the revised BNA data. 2010 saw 7.378 MWp of new
installations, a new world record. Note that the Environment Ministry
BMU has come up with a revision of data for 2010, which results in a
new capacity of only 6.988 MWp for that year. That record was soon broken
the next year (2011), with 7.485 MWp recorded by BNA (preliminary data;
note that from the 9,4 GWp recorded in Italy, 3,7 MWp had already been
"installed" in 2010, but not yet connected to the grid - source:
Photon 5/2010...).
Big
PV-installations
The impact on total installed capacity of PV-installations is partially
the result of many large solar power plants of 100-1.000 kWp or even
larger being reported. In the 2010
and 2011 overviews several
of such large installations have been highlighted. There has been considerable
growth of the larger system segments since end of 2011. The enormous
MWp installation peaks result from "pre-degression-date-rushes"
that are so typical if a successful, uncapped feed-in tariff regime
enters into a new tariff phase in times that huge numbers of containers
with cheap Asian/Chinese PV-modules can be found in all European harbours.
In Germany these rushes have become huge, and they are one of the reasons
why in Berlin some politicians want to get rid of support for PV altogether.
Large MWp peaks are apparent in December 2011, March and June 2012.
The "March Peak" might be the result of a "previously
unplanned, hasty 100-1.000 kWp installation rush" due to the sudden
announcement of German Ministers Röttgen/Rößler that
in April incentives would be dramatically cut back as compared to the
already strongly adjusted tariffs valid as of Jan. 1, 2012. The June
2012 rush is probably the result of large free-field installations that
had their building permits in time, but that were allowed a few months
extra to realize the huge projects under the "old" EEG regime
(with higher tariffs than planned as of April 1, 2012). A similar, huge
"rush" has now occurred in September of 2012: the last month
that big installations could be "delivered" with the high
incentive for the start of that year. In that month only, 48 portions
of big solar parcs were registered with BNA, resulting in a staggering
volume of 516 MWp for that segment only. That is more than 3 times total
accumulated capacity "officially" known in neighbouring Netherlands
up till August 2012...
More
graphs
In
this section I present further graphs of development of the German photovoltaic
market. If time allows to synthesize more data, they will appear on
this webpage.
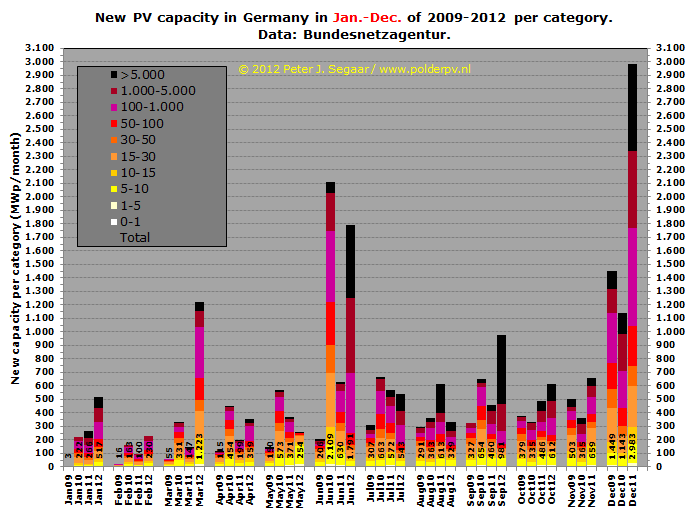
Monthly
capacity growth differences 2009-2012
KLIK
op plaatje voor uitvergroting
Big
installations having huge impact on volume growth
This graphs shows those presented in the first graph,
but now with yearly installation records for each month presented side
by side. The largest fluctuations arise from new "feed-in degression
dates", that have been fixed by politicians in Berlin. "Notorious"
examples are July 2010, which pushed a - then world record - installation
rush in June. December has always been the "busiest month",
since every year "natural feed-in degression" starts at January
1 of the new year. The "rush" for December 2011 has been incredible,
establishing a new world record month volume of 2,983 GWp in 31 days.
That is an astonishing volume of over 93 MWp on average
a day, Christmas and New Year's Eve - hypothetically - included. Only
the category >100 kWp (here divided in three installation category
segments by me) brought 1,94 GWp on-line in that month, 65% of total
volume...
In
2012, March saw another installation rush, as most investors feared
the brutal incentive cuts announced
by Röttgen/Rößler for April. This highly politically
motivated desaster policy (later turned down by the Bundesrat, necessitating
a review and leading to Röttgen's
demise after another hefty blow in regional elections for CDU) resulted
in an extra 1,22 GWp of additions. Since free-field installation projects
with permits could still realise in the summer under the "old"
incentives, it came as no surprise that another huge peak was recorded
by BNA in June 2012: again 1,79 GWp was added in 30 days. The overwhelming
majority of the capacity involved, again, has been installed in the
>100 kWp category in that summer month: 1,54 GWp, 86% of total volume.
For comparison: in Jan. - Jun. 2012, the smallest category up till 10
kWp claimed, on average, a volume of only 70 MWp per month (high volume
of March included). However, in June 2012 only 42 MWp has been reported
for this residential category...
In
July and August 2012 less volume was added as in those months in the
previous year, in particular so for August. However, 329 MWp still is
a large volume for one holiday month. That volume was dwarfed by the
(final?) "big installation rush" in September, bringing another
large volume of 981 MWp on-line. Even October did well, with 612 MWp
added. It remains to be seen how "effective" the break-down
policies of the EEG regime (with now monthly degressions of FITs for
new installations) will turn out to be in coming month reports of Bundesnetzagentur.
CLICK
on graph for enlargement
Detail
of graph with new capacity of PV-installations per year per category
(MWp), focussing on the smaller ("residential") market segments
up till 10 kWp (partly off-scale in the image). In particular the segment
up till 5 kWp, fitting on many smaller houses in Germany, is important
since it is the "barometer" of the most important public market
segment. Installation costs are most apparent with small system sizes
and become a very important factor in all-system price with relative
low cost of the modules. In this detail graph, the smallest segment
(1-5 kWp) is represented in light yellow columns at the bottom of the
graph. Stacked on top of that is the >5-10 kWp segment (yellow),
and so on. From the low volumes in the months not previous to (expected)
feed-in degression dates in 2012 (level 4-24 MWp for 1-5 kWp category),
it is apparent that the volume of "small" installations is
becoming an ever smaller segment of total market volume. However, a
large part of the burden to pay for the EEG feed-in, has to be born
by civilians having a roof suited for such a PV-system size. It is clear
that this discrepancy between realized capacity on "normal"
residential roofs, and the ever growing mass of large to huge size scale
PV-installations cannot continue indefinitely, if positive social acceptance
for support for solar is considered a major goal for the industry in
Germany.
Interestingly,
in the period since summer 2012, there seems to be some growth again
in the "smallest categories" in the EEG data. This is good
news, but FITs will go down each month. Will module prices be able to
keep track of that killing pace downwards?
|
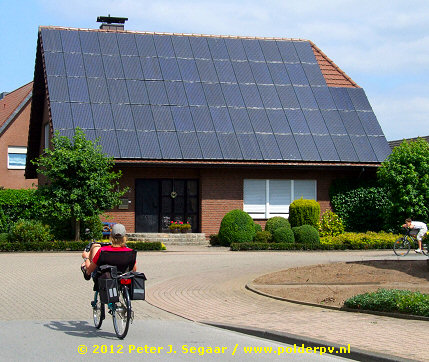
^^^
New small PV-installations with sizes less than 5 kWp become
rarer in Germany. This "residential" PV-system, having
81 black mono panels, could easily have a system size over 18
kWp if modules of 225 Wp or larger have been applied. It is
highly improbable that system production and on-site electricity
consumption will be even remotely in balance (an 18 kWp installation,
oriented south, could easily produce far beyond 16.000 kWh a
year in Germany). In most situations (in Germany), all electricity
is fed into the local grid.
Photo
taken in Stadlohn during short cycling trip in the
"Green Border" region between NL and Germany, beyond
Winterswijk (see photographic impressions in this
contribution by Polder PV).
|
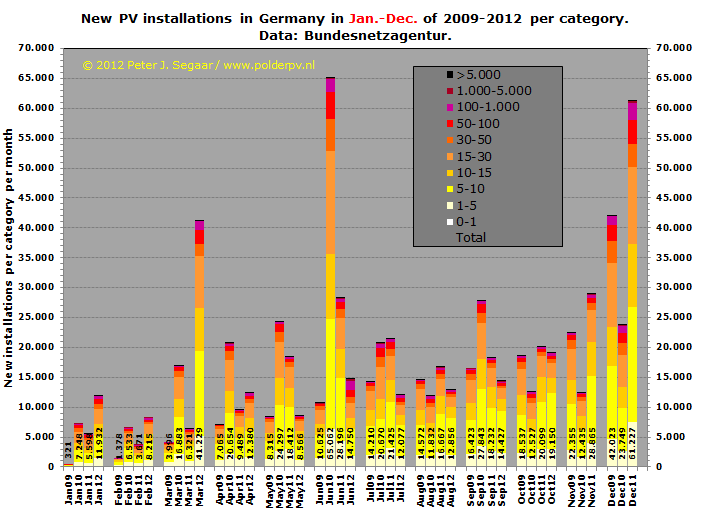
Monthly
installation growth differences 2009-2012
CLICK
on graph for enlargement
Figure
comparable with the one for capacity, now showing
number of installations per year and per month. Despite the many cut-backs
in incentives for PV-installations in Germany, the number of new installations
realized remains phenomenal. Here the monthly additions are shown. Per
year the following numbers have been added according to (revised) Bundesnetzagentur
data; 2009 159.820, 2010 249.733 (world record), 2011 238.719.
If
we compare the data for the first 10 months (January
up till, and including, October) of 2012 with those for the previous
years, the following list appears:
Progressive
development of Germany's PV market in 2012
Progressieve ontwikkeling van de PV-markt in Duitsland in 2012
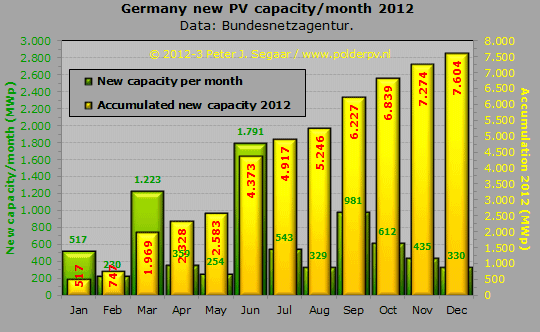
Progressive
development of installed capacity of photovoltaic installations in Germany
in 2012, extracted from the month reports published by Bundesnetzagentur.
In green columns the new capacity per month in MWp (refer to left Y-axis
for scale). In yellow with red numbers the accumulation of newly installed
PV-capacity reported to BNA as of January 1, 2012 (refer to right Y-axis
for scale).
Figure
comparable to previous graph, this time showing progressive development
of number of photovoltaic installations in Germany in 2012. In green absolute
new numbers per month (refer to left Y-axis for scale), in yellow, with
red numbers, the accumulation of these data for January - October 2012
(refer to right Y-axis for scale).
Important
note
There is growing discussion
on the "validity" of the data of Bundesnetzagentur, which can
differ considerably from those provided by the so-called ÜNB's (the
four high voltage network operators in Germany). For a very interesting
update of the problems behind those politically very sensitive data, see
this contribution (in German) on Solarserver.de:
Solarserver.de
on problems with Bundesnetzagentur data
Also
August data between the two data providers not in line with each other
Proteus
Solutions on differences between Bundesnetzagentur and ÜNB data
(with graphs, April 17, 2012)
Links
Statistical
data:
© Bundesnetzagentur
(BNA)
Many
studies with overwhelming details, numbers, and graphs, on developments
with respect to the implementation of EEG Law and renewables in Germany
can be found on the very well documented, unique site "Erneuerbare
Energien" by the Ministry of Environment in Germany, BMU:
http://www.erneuerbare-energien.de/inhalt/
Additional
calculations and graph production: Polder
PV. Errors and miscalculations are the responsibility of Polder PV.
Please notify the
webmaster if you find any.
Webpage
initially published on August 20, 2012. Updated October 8, 2012, December
1, 2012.
|