|
|
  
Weltmeister
in slow retreat
Update
May 2013¹
A first insight in Germany's market growth in photovoltaics in 2013
Voorlopige
cijfers ontwikkeling fotovoltaïsche markt en zonnestroom productie
2013 in Duitsland
¹
Based
upon BNA data for January 2009 up till - and including - May 2013
Further
PV-market analyses for Germany:
2012 2011
2010-II 2010-I
2009 2008
2007 def. 2007
cf. BSW 2006 2005
©
Data graph: BMU/AGEE Stat, Bundesnetzagentur (Germany); CBS/StatLine,
CertiQ (NL)
Graph: www.polderpv.nl,
Leiden (NL)
Note:
in graph, "10.534" reads as "10534 MWp" (or "10
534 MWp" = 10.534 GWp)
Update
for Germany with all Bundesnetzagentur (BNA) data and revisions included,
up till, and including, May 2013. For year accumulations the most recent
data from the so-called "Zeitreihen"
publication of the German Environment Ministry (BMU) and the AGEE
Statistics group has been taken as basic reference (all years included
as of 1990, update Feb. 28, 2013). Comparison with minute micro-market
Netherlands in red-lined box (same scale, 1 GWp line
indicated but still far beyond reach), including preliminary accumulated
capacity for the year 2012 using the most recently published CBS data.
To that preliminary 2012 outcome, the known certified installations
published by CertiQ for January up till May 2013 has been added. Note,
that the absolute majority of new installations is not certified
in Netherlands, but that its progression in 2013 remains an enigma until
CBS generates new first data somewhere in May 2014. The market in NL
has grown strong, but total [accumulated] capacity still is far below
500 MWp.
With
all known revisions by Bundesnetzagentur, 2012 saw
another world record market installation volume of 7604
MWp and over 188000 new PV-installations (registered entries
in the BNA spreadsheets, volume shown in bright-green
column segments). Note, however, that data for earlier years may still
be adjusted in coming reports.
Progress
with Gigawatts
With the new and revised monthly installations, total accumulated
German PV-capacity has broken the 15 GWp barrier in September 2010,
and surpassed 17 GWp end of December of that previous record year. The
20 GWp barrier has been surpassed with the August 2011 data provided
by Bundesnetzagentur. That impressive volume has been reached in a relatively
short time after breaking the "magic" 10 GWp barrier (accumulation
of grid-connected PV-systems) in January or February 2010, depending
on the data source for accumulated MWp level in previous years. 2011
has easily passed 24 GWp of accumulated capacity. In June 2012 already
over 29 GWp has been reached, and finally, the "magical" volume
of 30 GWp has been surpassed in July 2012. Although the capacity build-up
has been severely tempered because of hefty cuts in the FIT levels,
and very strong political turmoil around Germany's fascinating "Energiewende",
new capacity data still show "respectful" levels. The present
page gives some graphic details of a former world record PV-market cooling
off.
Small,
red-lined box for Netherlands in first graph based on CBS (only once
a year results are being published, 2012 preliminary data became known
only as
late as May 23, 2012), but will certainly have to be revised substantially
later in 2013. From the last available accumulation data obtained by
Polder PV from CertiQ, it could be derived that at least 20.9 MWp new
certified volume has been added in 2012, and that between Jan. and June
1. 2013 11.2 MWp new certified volume has been published. This brings
"accumulated capacity", known from data in official
reports, and own calculations, at roughly 351 MWp end of May 2013 (excluding
not yet known "non-official, not-registered, un-certified new volume").
That "351 MWp" is only 1% of the accumulated ("all certified")
volume in Germany end of May 2013...
Note
again, that in NL also a large volume (double-digit MWp) will have to
be added that has not been certified in the first half year
of 2013. A law-enforced obligatory central registration for this majority
of new PV-installations is still absent in Netherlands. Although the
"PIR" register opened by the net managers is filled rapidly
with many new installations. Hard numbers are very hard to obtain, complete
data almost impossible...
Samenvatting
Op deze
pagina de eerste grafieken met cijfers over de realisatie van zonnestroom
vermogen en productie in Duitsland in 2013, volgens cijfers van het BNA
(Bundesnetzagentur), een ambtelijke organisatie onder het Bundeswirtschaftsministerium
("Economische Zaken van Duitsland"). Een groot deel van de opzet
en basis informatie is ontleend aan de zeer gedetailleerde overzichten
van voorgaande jaren en aangepast daar waar recenter cijfermateriaal is
gepubliceerd.
Update
capaciteit: BNA spreadsheets tm. mei 2013 (update van
30 mei 2013 op hun EEG
statistiek web pagina). De impressionante resultaten vanaf januari
2012:
2012
- Januari
2012: 516,6 MWp, 11.932 nieuwe installaties aangemeld.
- Februari
2012: 229,9 MWp, 8.215 nieuwe installaties aangemeld.
- Maart
2012: 1.222,8 MWp, 41.229 nieuwe installaties aangemeld.
- April
2012: 359,0 MWp, 12.380 nieuwe installaties aangemeld.
- Mei 2012:
254,2 MWp, 8.566 nieuwe installaties aangemeld.
- Juni 2012:
1.790,9 MWp, 14.750 nieuwe installaties aangemeld.
- Juli 2012:
543,2 MWp, 12.077 nieuwe installaties aangemeld.
- Augustus
2012: 329,4 MWp, 12.856 nieuwe installaties aangemeld.
- September
2012: 980,8 MWp, 14.427 nieuwe installaties aangemeld.
- Oktober
2012: 611,9 MWp, 19.150 nieuwe installaties aangemeld.
- November
2012: 435,3 MWp, 17.282 nieuwe installaties aangemeld.
- December
2012: 330,1 MWp, 11.434 nieuwe installaties aangemeld.
2013
- Januari
2013: 274,7 MWp, 9.325 nieuwe installaties aangemeld.
- Februari
2013: 211,2 MWp, 8.378 nieuwe installaties aangemeld.
- Maart
2013: 290,5 MWp, 11.509 nieuwe installaties aangemeld.
- April
2013: 367,7 MWp, 13.414 nieuwe installaties aangemeld.
- Mei 2013:
344,2 MWp, 11.574 nieuwe installaties aangemeld.
- Voorlopige
accumulatie januari tm. mei 2013: 1.488 MWp; 54.200
nieuwe installaties aangemeld (gemiddelde installatie grootte: 27,5
kWp, ongeveer 110 PV-modules met een vermogen van 250 Wp).
- Voor maandresultaten
sinds bij Bundesnetzagentur aanmelding verplicht was om de EEG Einspeise
Vergütung te kunnen claimen m.b.t. PV, 2009 tm. 2013, zie grafieken
hier onder waarin vergelijking tussen jaren zichtbaar is gemaakt.
- Voorlopige
accumulaties 2010 resp. 2012 / gehele kalenderjaar:
7.378, 7.485, resp. 7.604 MWp volgens de Bundesnetzagentur opgaves,
een spectaculair nieuw vermogen van 22,5 gigawatt in drie jaar tijd.
Echter, in de herziene "Zeitreihen"
van het Milieu Ministerie (status: eind feb. 2013) is het volume
voor 2010 fors naar beneden bijgesteld, en bedraagt dat inmiddels 17.554
- 10.566 (accumulaties totaal volumes 2010 resp. 2009) = 6.988 MWp,
wat 5,2% minder is dan volgens de gepubliceerde cijfers van Bundesnetzagentur.
Het is waarschijnlijk dat de latere cijfers vanaf 2011 ook nog worden
bijgesteld. Het laatste gereviseerde overzicht, EEG Statistikbericht
van Bundesnetzagentur, gaat over het jaar 2010 (publ. aug. 2012).
Graphs
comparing PV capacity evolution between years in Germany - per month and
per quarter 2009-2013
Note: scale Y-axis
may vary per month shown in graphs. "11.932" reads as "11932
installations", "516,6" should be interpreted as "516.6
MWp nominal capacity" [STC of generator].
January
February
March
Capacity
in first quarter (Q1: January - March)
April
May
Graphs
made from BNA data/Grafieken gemaakt van BNA data. UPDATE:
May 2013
(including partial revision of previous data)
Last
data added: Bundesnetzagentur spreadsheet May 2013 (Status: June 19,
2013; website update: June 30, 2013).
All
raw data in this section from Bundesnetzagentur (FRG) unless stated
otherwise.
Graphs made by Peter J. Segaar/Polder
PV, Leiden (Netherlands).
New
capacity per month - segmentation
CLICK
on graph for enlargement
Newly
added nominal photovoltaic (DC) capacity per month (MWp,
left Y-axis) in Germany in the period 2009-2013 (up till, and included,
May 2013, and earlier published month revisions up till May 2011). Growth
has been absolutely unprecedented for a long time, originally with only
significant low volumes in the winter months January and February, in
which roof and field work mostly is impossible due to snow and freezing
conditions. New year volume in 2009 has been 4446 MWp according to revised
BNA data. 2010 saw 6988 MWp of new installations (revised), 2011 produced
7485 new capacity (not yet revised), and the preliminary data for 2012
reported a new record volume of 7604 MWp.
Big
PV-installations
The impact on total installed capacity of PV-installations is partially
the result of many large solar power plants of 100-1000 kWp or even
larger being reported. In the 2010
and 2011 overviews several
of such large installations have been highlighted. There has been very
strong growth of the larger system segments since end of 2011. The enormous
MWp installation peaks result from "pre-degression-date-rushes"
that are so typical if a successful, uncapped feed-in tariff regime
enters into a new tariff phase in times that huge numbers of containers
with cheap Asian/Chinese PV-modules could be found in all European harbours.
In Germany these rushes have had a very high impact of total volume
added in the "pre-FIT-change months". And they are one of
the reasons why in Berlin some politicians want to get rid of support
for PV altogether.
High
MWp peaks are apparent in December 2011, March, June, and, ultimately,
in September 2012. The "March Peak" might be the result of
a "previously unplanned, hasty 100-1000 kWp installation rush"
due to the sudden announcement of German Ministers Röttgen/Rößler
that in April incentives would be dramatically cut back as compared
to the already strongly adjusted tariffs valid as of Jan. 1, 2012. The
June 2012 rush is probably the result of large free-field installations
that had their building permits in time, but that were allowed a few
months extra to realize the huge projects under the "old"
EEG regime (with higher tariffs than planned as of April 1, 2012). A
similar, huge "rush" has occurred in September of 2012: the
last month that big installations could be "delivered" with
the high incentive for the start of that year. In that month only, 48
portions of big solar parcs were registered with BNA, resulting in a
staggering volume of 516 MWp for that segment only. That is 1.5 times
total accumulated capacity "officially" known in neighbouring
Netherlands up till December 2012 (first data published May 23, 2013)...
More
graphs
In
this section I present further graphs of development of the German photovoltaic
market. If time allows to synthesize more data, they will appear on
this webpage.
Monthly
capacity growth differences 2009-2013
KLIK
op plaatje voor uitvergroting
Big
installations having huge impact on volume growth
This graph shows the data presented in the first graph,
but now with yearly installation records for each month presented side
by side. The largest fluctuations arise from new "feed-in degression
dates", that have been fixed by politicians in Berlin. "Notorious"
examples are July 2010, which pushed a - then world record - installation
rush in June. December has, for a long time, been the "busiest
month", since every year "natural feed-in degression"
started at January 1 of the new year. The "rush" for December
2011 has been incredible, establishing a new world record month volume
of 2.983 GWp in 31 days. That is an astonishing volume of over 93 MWp
on average a day, Christmas and New Year's Eve - hypothetically
- included (see also graphs on daily basis below). Only the category
>100 kWp (here divided in three installation category segments by
me) brought 1,94 GWp on-line in that month, 65% of total volume... (and
over 13 times the accumulated volume - 146 MWp - in Netherlands,
end of 2011).
In
2012, March saw another installation rush, as most investors feared
the brutal incentive cuts announced
by Röttgen/Rößler for April. This highly politically
motivated desaster policy (later turned down by the Bundesrat, necessitating
a review and leading to Röttgen's
demise after another hefty blow in regional elections for CDU) resulted
in an extra 1.22 GWp of additions. Since free-field installation projects
with permits could still realise in the summer under the "old"
incentives, it came as no surprise that another huge peak was recorded
by BNA in June 2012: again 1.79 GWp was added in 30 days. The overwhelming
majority of the capacity involved, again, has been installed in the
>100 kWp category in that summer month: 1.54 GWp, 86% of total volume.
For comparison: in Jan. - Jun. 2012, the smallest category up till 10
kWp claimed, on average, a volume of only 70 MWp per month (high volume
of March included). However, in June 2012 only 42 MWp has been reported
for this residential category...
In
July and August 2012 less volume was added as in those months in the
previous year, in particular so for August. However, 329 MWp still is
a large volume for one holiday month. That volume was dwarfed by the
(final?) "big installation rush" in September, bringing another
large volume of 981 MWp on-line. October and November still brought
considerable new volume. However, for the first time in a long tradition,
the December 2012 volume has been very moderate, only 330 MWp was brought
on-line in that month. This was because no dramatic free-fall of the
FIT was to be expected for January 2013.
The
first five months for 2013 brought "moderate" volumes, with
April sofar bringing the highest volume, 368 MWp. A month capacity that
still would make many countries happy if it would be installed within
a whole year. But for Germany a sign on the wall that the golden years
are over. And that with political turmoil concerning the spectacular
Energiewende, prediction of another strong rise of the so-called
EEG Umlage (the bonus on the kWh price that should be borne by all electricity
users - many companies however excluded), low remaining feed-in tariffs,
and "correcting" customs fees on imported Chinese PV-modules,
another era has started in "the former world champion on photovoltaics".
That will be side-stepped by Japan, China, and USA within the present
year.
CLICK
on graph for enlargement
Detail
of graph with new capacity of PV-installations per year per category
(MWp), focussing on the smaller ("residential") market segments
up till 10 kWp (partly off-scale in the image). In particular the segment
up till 5 kWp, fitting on many smaller houses in Germany, is important
since it is the "barometer" of the most important public market
segment. Installation costs are most apparent with small system sizes
and become a very important factor in all-system price with relative
low cost of the modules. In this detail graph, the smallest segment
(1-5 kWp) is represented in light yellow columns at the bottom of the
graph. Stacked on top of that is the >5-10 kWp segment (yellow),
and so on. From the low volumes in the months not previous to (expected)
feed-in degression dates in 2012 (level 4-24 MWp for 1-5 kWp category),
it seemed that the volume of "small" installations was becoming
an ever smaller segment of total market volume. As of July 2012, the
level of participation seems to have more or less stabilized - with
a dip in the snow-rich and cold winter months January and February 2013.
A
large part of the burden for the EEG feed-in, has to be paid by civilians
having a roof suited for such a PV-system size. It is clear that a large
discrepancy between realized capacity on "normal" residential
roofs, and the ever growing mass of large to huge size scale PV-installations
cannot continue indefinitely, if positive social acceptance for support
for solar is considered a major goal for the industry in Germany. With
the last changes in the EEG Law, installations larger than 10 MWp cannot
longer apply for support from EEG incentives, and FITs have again been
reduced on a monthly basis. It remains to be seen how strong the impact
of all the "negative factors" will be with realisation of
capacity. It is expected that a volume of app. 4 GWp possibly could
be realized in 2013. Still a respectable volume. But by long not enough
to lengthen Germany's supremacy in photovoltaic deployment for another
year.
|
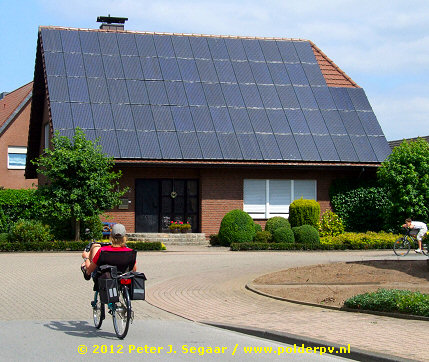
^^^
New small PV-installations with sizes less than 5 kWp become
rarer in Germany. This "residential" PV-system, having
81 black mono panels, could easily have a system size over 18
kWp if modules of 225 Wp or larger have been applied. It is
highly improbable that system production and on-site electricity
consumption will be even remotely in balance (an 18 kWp installation,
oriented south, could easily produce far beyond 16000 kWh a
year in Germany). In most situations (in Germany), all electricity
is fed into the local grid.
Photo
taken in Stadlohn during short cycling trip in the
"Green Border" region between NL and Germany, beyond
Winterswijk (see photographic impressions in this
contribution by Polder PV).
|
Monthly
number of installations growth differences 2009-2013
CLICK
on graph for enlargement
Figure
comparable with the one for capacity, now showing
number of installations per year and per month. Despite the many cut-backs
in incentives for PV-installations in Germany, the number of new installations
realized remains phenomenal. Here the monthly additions are shown. Per
year the following numbers have been added according to (revised) Bundesnetzagentur
data; 2009 159820, 2010 249733 (world record, with population of that
year that was approximately one out of 327 Germans with a brand-new
PV-system), 2011 238719, 2012 184298.
If
we compare the data for the first 5 months (January
up till, and including, May) of 2013 with those for the previous years,
the following list appears:
Progressive
development of Germany's PV market in 2012-2013
Progressieve ontwikkeling van de PV-markt in Duitsland in 2012-2013
2012
2013

Progressive
development of installed capacity of photovoltaic installations in Germany
in 2012 and 2013, extracted from the month reports published by Bundesnetzagentur.
In green columns the new capacity per month in MWp (refer to left Y-axis
for scale). In yellow with red numbers the accumulation of newly installed
PV-capacity reported to BNA as of January 1, for the year graphs presented
(refer to right Y-axis for scale).
In
the next two graphs similar views of development of the number of installations
per month, in 2012 and 2013:
2012
2013
Figure
comparable to previous set of graphs, this time showing progressive development
of number of photovoltaic installations in Germany in 2012 and 2013. In
green absolute new numbers per month (refer to left Y-axis for scale),
in yellow, with red numbers, the accumulation of these data per month
(refer to right Y-axis for scale).
Graphs
with BNA registrations per day and per week
CLICK
on image for enlargement (click twice if necessary)
Status:
May 2013.
Graph includes all published BNA month revisions for data up till (and
included) May 2011.
For year overviews of new installations reported on a daily basis, see
below.
Continuous
sequence as of Jan. 1, 2009
(see also details below)
Registered number of installations and total capacity per day at the Bundesnetzagentur
office. All installations have a day-stamp in the Excel files produced
by BNA. Clearly, the weekend interruptions can be seen in this graph (no
or very little entries on weekend days). All registrations are lined up,
starting from January 1, 2009 (beginning of EEG Novelle-dictated registrations
at BNA) up till May 31, 2013, at the right of the X-axis. In blue-rimmed
columns number of installations with scale on right Y-axis;
in yellow filled columns total capacity registered on the day shown in
kWp, scale on left Y-axis.
Installation
rushes clearly visible on daily basis
High peaks in the graph indicate the typical "end of former interesting
feed-in regime" rushes. Just prior to a certain date (fixed by Berlin
politicians, sometimes after heavy battles in parliament) private persons
as well as big investors try to finish their new installations under the
old, more profitable incentive regime (feed-in-tariff for 20 years). In
particular with respect to "just-in-time-finishing" of big solar
parcs, enormous reporting peaks in capacity are visible in the graphs
on certain days. For four "earlier" details of this graph, showing
the end of June 2010, end of September 2010, and the December 2010/January
2011 reporting peaks, as well as the "false" June/July 2011
peak, see the graphs in
the report for 2011.
For the
end of 2009 December rush (due to law-derived degression percentages as
of Jan. 1, 2010 8-11%) the pre-Christmas-day of December 23 had its record
number of installations registered (2939 entries), as well as with respect
to total new capacity: 137.1 MWp on one day. The June 30, 2010 former
world record (442 MWp reported in one day) was later followed one and
a half year later, by a incredible 756 MWp on December
19, 2011. This was because end of that year no more new big PV-installations
were allowed under the EEG incentive regime on agricultural premises,
so all efforts were undertaken to get most profit from often long-planned
sites before the dead-line. Because of coming Christmas, the investors
focussed on finishing their installations before those problematic days.
This all resulted in this enormous volume reported on one day. Mind you:
with "only" 2500 installations reported on that day (system
average
reported on that day: 303 kWp per installation).
In 2010,
the third degression step, that of October 1 (3% extra degression for
all new installations as of that date) showed only a relatively low peak
at September 30, originally reporting 71.1 MWp by Bundesnetzagentur. However,
in the December 23, 2010, update for September 2010, a large new volume
was added and many installations, resulting in a considerable peak of
4783 new installations on that day, with an accumulated volume of 162.3
MWp (128% more than originally published!).
Although
the volumes for the snow-rich December 2010 month have appeared lower
than expected, it is clear that the end of 2010 has resulted in a relatively
large number of big installations.
Next,
a "false" peak appeared prior to a widely expected
tariff degression as per July 1, 2011, part of planned law-enforcement
by Germany's conservatives that even
by Photon's high standards was considered as a so-called "Solarstromabwürgungsgesetz"
(Law to strangle the market conditions for solar electricity). Due to
slow market growth in Spring of that year, however, the degression was
not implemented, as already predicted
by Polder PV on June 27, 2011. However, that was not known at that
time, and many investors, large and small, did not take the chance that
their installations would fall in a lower feed-in category if they would
have connected their PV-installations to the grid after that threatening
first of July, 2011. The resulting "peak" has remained relatively
modest for world market Germany, "only" 2311 new installations
with 74 MWp of capacity on June 30, 2011.
End of
2011 has seen enormous installation volumes, and in particular new capacity
coming from many large field installations, resulting in various peaks
in the last days of that year. Between December 19 and the end of Dec.
31, a staggering volume of 34466 new installations has been reported,
with an accumulated volume of 2.36 GWp in only 13 days.
Another
new degression date, April 1, 2012, has been bitterly contested
in the struggle for Rösler and Röttgen's desastrous EEG law
revision proposals earlier that year. This has ultimately resulted in
the Bundesrat changing several dramatic issues in retrorespect
(see article with details in Dutch published on July
16, 2012). Many people did not want to wait until that "threatening"
date, and, again, a new "installation rush" was born. Resulting
in 4.581 new installations reported on the last working day, March 30,
2012 (Friday, 170 MWp; the last day, March 31, added another 1.785 reported
installations with 67 MWp on Saturday).
Two "last
big rushes" were reserved for the "big installations".
Those that had a building permit before March 1 were allowed to realize
their installations up till June 30 under the profitable old conditions
(tariffs as of Jan. 1, 2012). Large field installations could realize
until first of September 2012 under those conditions. The result is again
apparent in the graphs with daily claims at Bundesnetzagentur. A large
volume of 386 MWp (yellow peak) was claimed for June 29, 2012, for 1.768
projects (and much more volume for big installations in the days before).
A "final big rush" established itself in the last days of September
2012. With several days over 100 MWp of new capacity reported, September
26, 2012, the most striking one reporting with 132 MWp for 962 new installations.
Degressions
still occurring, but effects relatively small
After these "final of the finals", degressions have been introduced
on a monthly basis. The result is that there still is a trend towards
a "rush just before the end of each month". But those "rushes"
have become much smaller than previously. Resulting in a "maximum"
of 98 MWp for 1.409 new installations reported on April 30 in 2013. Since
there has not been a dramatic FIT degression on January 1, 2013, for the
first time there has not been a large installation rush at the end of
December of the previous year. Degression as per Jan. 1, 2013 has been
2.5%, and continues to be implemented each month for new installations
(see also overview
at website of SFV). In the last image for 2013, with adjusted Y-axis (volumes
not as high as in previous years), the "small rushes on a monthly
basis" are clearly visible.
In the
next graphs, the calendar year images are given for the new installations
reported at Bundesnetzagentur on a daily basis. Note that the Y-axis varies
among the calendar year shown. CLICK on images for enlargement.
2009
2010
2011
2012
2013
(up till May)
Graphs per
week
In this final section,
the daily numbers published by German Bundesnetzagentur have been averaged
per calendar week, resulting in a more "homogeneous" character
of the graphs and avoiding strong variations on a day-to-day basis. In
the X-axis the calendar weeks have been shown coded "xx-yy".
Where "xx" stands for the year (short in 2 numbers, "09"
= 2009), and "yy" for the official calendar week in that year.
For those official week numbers, take a look at, a.o., www.calendar-365.com.
In this
graph, the number of new installations reported in the Bundesnetzagentur
spreadsheets per calendar week have been shown. The "installation
peaks" relate to the many - politically motivated - degression dates
for the FITs in Germany. A few "harsh" degressions in the early
years leading to sometimes very large peaks. And "many smaller"
degressions as of autumn 2012 resulting in rather different graph dynamics.
Some highlights have been indicated with installation numbers reported
in the weeks under consideration. Absolute "winner" has been
calendar week 26 of 2010, in which, just prior to the widely "feared"
degression as per July 1, 2010 (FITs minus 13%), a huge number of 29710
new installations has been reported to BNA.
CLICK on image for enlargement
This
graph shows the average number (yellow columns, refer to left
Y-axis) and average new capacity (blue columns, refer to right
Y-axis) reported per day per calender week is shown. Again, the "installation
rush peaks" are clearly visible. The maxima per category have not
been reached in the same calendar week. For the average number per
day per week, the maximum again fell in week 26 of 2010, like has
been shown for the "absolute" week volume in the previous graph.
It reached a level of an incredible 4244 installations "on average
per day" in that week. However, for the maximum average capacity
reported in a week we must look much further to the right. There we find
an astonishing 187.5 MWp on average per day in calendar week 51, just
prior to Christmas and the end of the year 2011. That was just in time
for the 15% FIT degression starting on January 1, 2012.
Another
high peak can be found in week number 26 of 2012, just in time for project
developers could finalize their plans under the older FITs as a result
of political turmoil in Berlin. In that week a daily average of 181.6
MWp of new capacity has been recorded in the BNA offices. After the 90.3
MWp/day peak for the last week (39) that large field installations could
be delivered under older, higher FIT payments by the netmanagers (up till
September 30, 2012), conspicuous high volumes were not realized anymore.
In 2013, the highest level has become approximately 25 MWp on average
per day, per calendar week.
In this
final graph the average system size of newly reported PV-systems
at the BNA's office has been plotted from calculations per calendar week.
Again, "FIT-degression-related-rushes" are visible. Peaks become
higher and culminate in two "major highs". One in week 26 of
2012, the final chance for many larger PV-installations with a building
permit present up till March 1 of that year to opt-in for the previous,
lucrative FIT valid at the start of the year. Culminating in a very large
"average weekly system size" of 178.4 kWp (average
of all installations in that week!). And a second in week 39, the last
chance for large field installations to opt-in for the FIT at the start
of the year, yielding a system average of 109.3 kWp in that week.
The (max.)
52 kWp average in week 22 of 2013 has more than halved that "week
average", which is the result of the fact that large field systems
are maximized to a level of 10 MWp per installation to be eligible for
a FIT onder Germany's newly adjusted EEG 2012.
Important
note
There is discussion
on the "validity" of the data of Bundesnetzagentur, which can
differ considerably from those provided by the so-called ÜNB's (the
four high voltage network operators in Germany). For an interesting view
of the problems behind those politically very sensitive data, see this
contribution (in German) on Solarserver.de:
Solarserver.de
on problems with Bundesnetzagentur data
Also
August data between the two data providers not in line with each other
Proteus
Solutions on differences between Bundesnetzagentur and ÜNB data
(with graphs, April 17, 2012)
Links
Statistical
data:
© Bundesnetzagentur
(BNA)
Many
studies with overwhelming details, numbers, and graphs, on developments
with respect to the implementation of EEG Law and renewables in Germany
can be found on the very well documented, unique site "Erneuerbare
Energien" by the Ministry of Environment in Germany, BMU:
http://www.erneuerbare-energien.de
Additional
calculations and graph production: Polder
PV. Errors and miscalculations are the responsibility of Polder PV.
Please notify the
webmaster if you find any.
Webpage
initially published on June 12, 2013. Update July 2, 2013.
|