| |
                    
(Growth
of) solar electricity (PV) in the Netherlands¹
PV market data Netherlands (CBS statistics) status: up
till 2009
Graphs:
1.
New sales to end users per year
2.
New PV-capacity reported per year
3. Accumulation of sales to end users
4.
Accumulated PV-capacity (2 graphs)
5.
Difference of sales minus new PV-capacity per year
6.
Roughly estimated accumulation of solar electricity production
7. Trade in PV modules
8. Turnover (business) and
Research budget in M. Euro
9. PV and jobs
Discrepancy of CBS and CertiQ
data?
First
CBS data "renewable" electricity
for 2009 here
Older
overview CBS "renewable" energy for 2005, with many graphs here
Certified
production of photovoltaic electricity (PV) in the Netherlands
(CertiQ data) status: end
of October 2010
Graphs Certiq
data
Accumulated
certified PV capacity
Yearly
CertiQ data (from monthly reports)
Comparison of Flanders <<>> Netherlands
monthly growth
Factual
update
>>> See
also: Yearly report
2009 complete update/revision! <<<
(graphs and tables)
¹ Also to be read as "An inconvenient truth"...
PV
in the Netherlands market data update
2009
Results
from the preliminary data from the Central Bureau for Statistics
(CBS) for PV market development in the Netherlands (2009, data
published
July 15, 2010). See English comments in the figure captions. Note
also the "discrepancy
subject". The previous, final Dutch-language report for
the year 2008 (74 pages) can be downloaded from the CBS site via this
web-page. Analysis for "solar" data, see
my comments on
August 19, 2009 (Dutch, includes solar thermal installations). Direct
access of actual PV statistics data on the CBS website via this
link.
Data © Centraal
Bureau voor de Statistiek, 2010 (see contact
page)
1
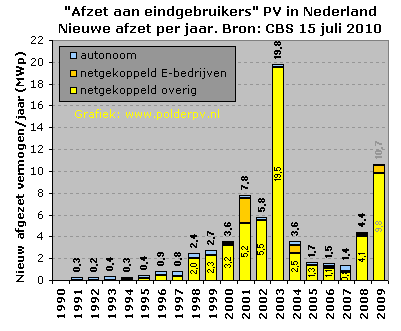
Fig. CBS 1. "PV-capacity
delivered to end-users in the Netherlands" which is described
by CBS as "capacity delivered
to installers" in the actual statistics database (accessable
via this
link). Blue:
autonomous
systems (off-grid),
orange: grid-connected PV-installations realized by energy
companies, yellow:
the most important category, private grid-connected PV installations
or PV-systems on roofs of companies, schools, etc. (before 2009
a rarity). For the latter category the actual numbers are also
shown in the yellow columns; total installation volume per year
is shown above the columns (all three "categories" together). The
- relative - 2003 "explosion"
has been the result of a stupid announcement of
the
government
that an extremely lucrative subsidy
regime
(for buying
PV systems, no
further restrictions, in the end some energy companies dumped the modules
almost for free...) would end, leading to a crazy run on modules
before the end of the
regime
early
in
2004.
No
(serious)
incentives
(only MEP, 9,7 eurocent/kWh on top of net metering up to August 2006)
till early 2008. New incentive, SDE, as of April 1 2008 (note:
only for new, grid-connected PV-systems!) still did not
have
an earth-rocking impact. Only 4,065 MWp "new private" and
0,151 "new E-company" (total:
4,2 MWp) grid-connected installations were added in 2008. In
2009 new installations added up to a disappointing 10,6 MWp (grid-connected
new), of which 9,8 MWp (92%) was in the "private" market
segment. Note that
maybe over 40% of that volume might not have a
SDE subsidy, since CertiQ registered
only 6 MWp of new installations for 2009 (hence: PV systems
metered with a separate "bruto productiemeter")...
2
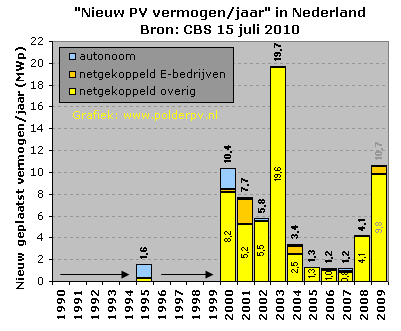
Fig.
CBS 2.Graph
depicting the "new capacity installed per year" according to the
previous (definitive) 2008 CBS report. Added to this
in the last column by Polder PV: the "capacity delivered to
installers" according
to the
latest (July 2010) update in the StatLine data of CBS, for
2009 (data in grey). Comparing Figs. 1 and 2
gives
the most striking
impact for 1995 and,
in
particular,
for
the year 2000, when the first big flush of subsidized small PV-packages
(mostly 4-6 modules per system) was offered by some energy
companies to their customers (Polder PV was one of them). The
arrows in Fig. 2 show that the CBS data for the periods 1990-1995
and 1996-2000 have been aggregated in the data for the last year
of each 5-year period (not split into separate year capacity).
As of 2001, yearly results have been published.
Apparently,
in the period 1995-2000, "official" (independent)
installers were bypassed,
since approximately 5 MWp was actually installed beyond the "official"
installer's reach (8,2 MWp "realized" minus 3,2 MWp "delivered
to installers"). Most probably through the existing infra
services of the energy
holdings
not
"officially"
recorded
as "installer" of PV-systems, and likely using
the direct supply chain from the Shell Solar production facility
in Helmond that was almost a monopolist on the small Dutch
market in those early years (factory closed in 2002). The big
energy
company chunks in the early years
(orange
in graphs)
are possibly the result
of the realisation
of Floriade 2,3 MWp roof in 2002 booked one
year earlier (NUON utility project), and Ecopark Waalwijk 674
kWp system grid-connected
end
of 2004
(Eneco utility project).
The
actual
fate of the
autonomous PV-systems remains unknown, as well
as the purpose of their application. Note that, despite the "presence" of a new incentive regime (SDE), 2009 only brought
approximately
half of the new capacity realized in 2003. If one considers
"delivery to installers" as a reliable representation of
"new installations" in that year. E-companies, absent
in the years 2005-2008, suddenly started subsidized
(?) PV-projects again in 2009...
3

Fig.
CBS 3. As
Figure 1, accumulation of PV capacity sold to end-users and/or
installers in the Netherlands (grid-connected installations dominating,
see Fig.
1). Data up till 2008: CBS report 2008 (definitive). Data for 2009
is preliminary. The present status is that in 2009 only 10,7 MWp
of new PV-installations might
have
been
added (compare with Flanders only: approximately 204
MWp new in 2009...).
Possibly
far
less than half of that volume has been installed under the
new "incentive" regime. See further under Figures 4-5 for "capacity
actually realized/installed" and difference between "capacity
sold" and "capacity
actually realized/installed".
4
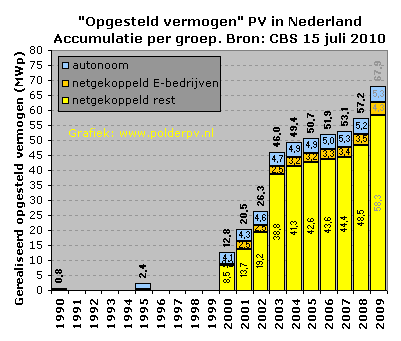
Fig.
CBS 4A. Actual
realisation of (accumulating) PV capacity in the Netherlands based
on CBS data. Stacked results
of the three separate categories (blue autonomous/off-grid,
orange grid-connected E-companies, yellow grid-connected rest).
For world market "impact", the grid-connected
category without the autonomous systems is the best indicator
of "good"
or "bad" incentive policies with respect to the implementation
of "effective" versus "defective" feed-in
regimes (see also Fig. 5).
Hardly
any growth
in the period 2004-2007, only little growth in first
SDE (new "incentive" regime)
year 2008 (SDE officially started on April 1 of that year).
According to the definitive CBS data for 2008 only 52,0
MWp grid-connected PV capacity had been accumulated in the
Netherlands in that year. Preliminary
data for "capacity delivered to installers" for 2009
shows that this 2008 number might have grown to (58,3 + 4,3
=) 62,6 MWp grid-connected capacity only (autonomous market
segment excluded, which has grown barely).
Note:
a growing number of highly subsidized modules from the early
years are
sold
at
internet
auctions and possibly part of those sales disappear out
of the country or are stored for longer periods of time, not producing
anything in the meantime. No one knows the
actual
status
of [grid-connected] capacity present, because the majority
of
the small systems, still the bulk in the market, and still
growing, is not monitored nor checked by independent authorities.
Older systems are
not
allowed
in the new "incentive" regime, SDE (that provides
a highly volatile kWh subsidy changing each year on top of
legally obliged, albeit capped net metering). In
addition, the actual impact of parallel imports of PV modules
not known
by Holland Solar/CBS, remains a mystery. In conclusion, numbers
for the Dutch market should be handled with caution.
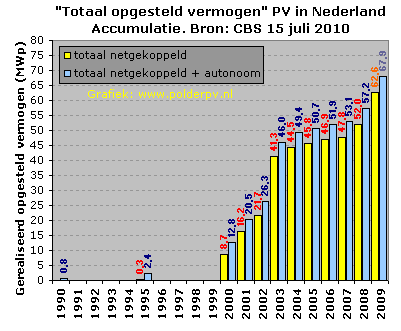
Fig.
CBS 4B. Graph comparable to Fig. 4A, but with two categories
and adjacent instead of stacked. Yellow columns: all grid-connected PV-installations
accumulated per year (CBS report 2008 definitive, 2009 data preliminary).
Blue columns: all PV-systems accumulated per year (grid-connected and autonomous/off-grid).
Autonomous
category
remains
small,
the market is driven by the grid-connected category like (almost) everywhere
in the world. Accumulation grid-connected in the Netherlands in 2009:
62,6 MWp. All systems together (data with questionmarks put by Polder PV):
67,9 MWp.
5
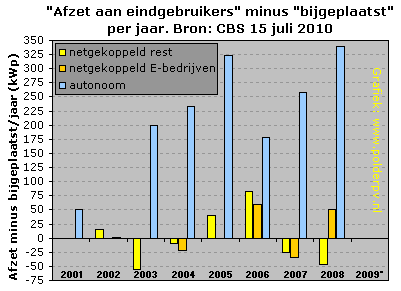
Fig.
CBS 5. Graph depicting
the difference between the CBS data "capacity delivered
to end users/installers" minus "new capacity installed" per
year (note: Y-scale in kilowattpeak, kWp). The remaining surplus "above
0" could be described as "in store" or "waiting
for installation"
with the installers (or, highly unlikely,
with the
end-users).
Surplus
"below 0" could be an indication that modules actually
installed were not obtained via installers or system houses known
by CBS or
its
data
suppliers. Note: an increasing number of "suppliers" are
active on the Dutch market (over 130 mostly small companies fighting
for market
share). Many of them are, however, not a member of the branche
organisation Holland Solar. In 2003 as well as
in 2008 a "considerable" difference of around minus 50
kWp was the result of this calculation for the most important category
("grid-connected rest"). This could indicate imported modules
from abroad by end-users themselves, highly unlikely because Holland
Solar/CBS
would not have the means of tracing those "installed" modules
(and therefore not appearing in the actual CBS data). Or it could
point to installers trading
in "gray
ware" that are known by H.S./CBS.
Even E-companies (orange columns) sometimes apparently installed
more
modules than were "officially
sold" to them, especially in the year 2007. It could also result
from a net yearly effect
of installing older stocks of PV modules when the national market
was almost dead and activity was almost exclusively buying and selling
modules from/to abroad (2004 up till the second half of 2008). Note
the huge amount of - apparent - positive surplus (in stock?) of autonomous
PV module capacity (blue columns).
An explanation is
not given
for
these -
for the small Dutch market - considerable numbers. 2009 data are
not yet known since actual (or: perceived) "installed capacity" has
not yet been published by CBS.
6
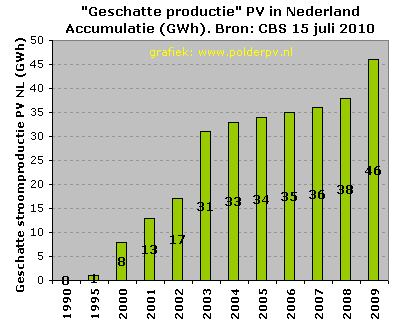
Fig.
CBS 6. CBS
also mentions three other data sets for PV in the Netherlands in
their definitive report for 2008, and in their latest, separate
update for "production of renewable energy" in
the Netherlands (full-statistical overview here).
For only one this is illustrated here (because these three
datasets
are directly interdependent via fixed calculation factors): electricity
production by the accumulated PV capacity depicted in the
earlier graphs
(in Gigawatthours,
GWh, see Fig. 6), "avoided"
use of fossil (actually also nuclear) primary energy (in TeraJoules),
and the avoided CO2 emissions, mainly coming from the coal and gas-fired
power plants
in the Netherlands (in kilotonnes). The older data can be found in table
5.1.1 in the CBS 2008 report (p. 38). In Figure 6 I present the so-called
"production" from the accumulated capacities given by CBS,
including 2009 update. These are, however, highly questionable data,
since the production is not measured,
but instead "calculated"! And for these calculations CBS uses
(as it does for many years) absurd basic data, mentioned on p. 40 of
the CBS
report for 2008. Data coming from a so-called "Protocol Monitoring
Sustainable Energy" from 2006 (original SenterNovem publication,
presently under review). These highly questionable data are: (1) grid-connected
PV systems "producing
700 kWh per kW a year",
and (2) autonomous PV installations
"producing 400 kWh per kW a year".
I
have serious objections against these phantasy "basic" data.
Even if you would not consider them as "serious production numbers",
these assumptions do not belong in a "hard numbers reporting" statistics
overview - certainly not in a "serious" national report!
I can tell, since my over ten years old, suboptimal grid-connected
multicrystalline PV system produces, on average between 900 and 950 kWh/kWp
a year, even with old inverters sometimes
suffering from heat stress and not producing electricity for half
a day. There are many other systems in the Netherlands producing
at least
800-900
kWh/kWp,
in
the coastal
region and in regions like in
Friesland often as much as (or even over) 1.000 kWh/kWp a year. A grid-connected
thin-film amorphous silicon system in the "sun-poor" eastern
part of the country
possibly
also will be able to produce such extensive output, because it appears
to be very effective in lower light conditions, as
revealed by Rob de Bree
from Siderea.nl, who has developed a remarkable accurate simulation
model for photovoltaics. The old "SenterNovem" data of
700 for "grid-connected"
is absolutely wrong, totally obsolete,
and far too low, making
any assumptions
on "calculated production" a farce and the CBS outcome
at least highly questionable. Certainly not "fit" to use
in comparisons with hard-measured data from other nations...
With
respect to autonomous systems: almost no one knows what comes out
of these
small
island
installations.
In addition: these systems often are applied because they are available
on the market, and in many cases do not "avoid"
fossil-based electricity production. There will have to be a very
detailed specification
of
the autonomous
systems sold, before any "fossil-avoiding" kWh production
can be claimed for these systems.
Taken
all this into account, what comes out of this wet-fingered fairy
tale CBS calculation is 38 GWh of assumed accumulated
production of solar electricity in the Netherlands
in the year 2008 (equally, for avoided primary "fossil energy" 330
TeraJoule is given, the avoided CO2 emission would amount to 23 kilotonnes).
Even considered far too low because of reasons given above, the 38
GWh "assumed production" is almost
next to
nothing, taking into account the long time that the Netherlands has
been "experimenting" with this fascinating technique. According
to
the accountant-approved BDEW
year report for 2008 (published July 27, 2009) Germany has already
produced 4.419,8 GWh
in 2008 by their half-a-million or so PV installations. 116
times
as much, for grid-connected ("EEG") systems only, and all
actually measured on a monthly basis (or even more frequently)
as proof for the feed-in payment rights fixed into the EEG law.
In
addition, Flanders, which has a population 2,7 times as small
as the Netherlands, and that has started only seriously
with solar in 2006, already had approved 33,6 GWh for certified "guarantees
of origin" (GVO's, one GVO stands for 1 MWh) for solar electricity
in 2008. With still a huge number of certificates awaiting approval
for that year.
In
2009
already
139,1 GWh of GVO's were issued by the VREG for Flanders, as stated
in their May 31 (2010) report, with a flood of new certificates
awaiting
approval (hence, in one year time, overhauling the Dutch production
with great strides). Flanders had almost
seven times the grid-connected capacity accumulated
by the Netherlands, end of June 2010, and
is still growing fast with implementation of photovoltaics.
7
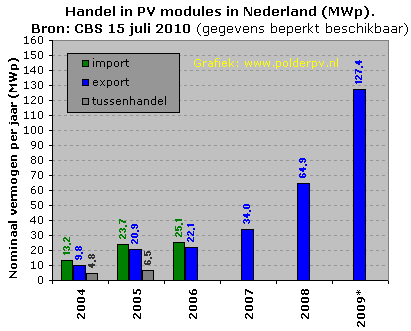
Fig.
CBS 7. The
inhabitants of the Netherlands ("the Dutch") in optima
forma:
trade. Hard numbers apparently are scarce, in the original CBS
publications (CBS year reports and StatLine downloads) a "cross" ("x")
in the data section is explained as "secret - CBS has
the data but cannot publish them because of contractual secrecy obligations".
Data can change in updates. The May 12, 2009 report published 58 instead of the
ultimate 65 MWp exported modules reported for the year 2008. Looking
at the trend in 2004-2006, with import of modules (green) only
slightly higher than the export numbers (blue), one can imagine that
the only interesting activity for the few market players in the Netherlands
was, and increasingly has become: importing cheap modules and selling
them for a "good price" abroad. The remaining
little bit of capacity was either
sold
on the
small domestic
market or further traded with or by second parties ("tussenhandel"),
either directly from the imports, or from older stock present (grey
column).
This
is shown clearly in the preliminary 2009 numbers: a considerable
volume of 127 MWp of PV-modules (doubling of 2008 volume) has been
exported, the other data, however, are considered "secret".
Since only something like 11 MWp has actually been installed in the
Netherlands in 2009 (Fig. 1), it is crystal clear that the
biggest profits in the homebase of the Dutch are
to be found in the trade segment encompassing a volume that is eleven
times bigger.
It
is also possible that, for example, some of the MWp solar parcs that
the Dutch company Scheuten Solar has
realized (and will build) in Puglia in southern Italy
are part of this trade channel: "import" from their German
Multisol®
module factory in Gelsenkirchen via their Dutch main office in Venlo
and "export" of those modules to Italy. No details are
given by CBS as
to the
nature of the "traded" volumes, so, again, many questions
remain unanswered.
8
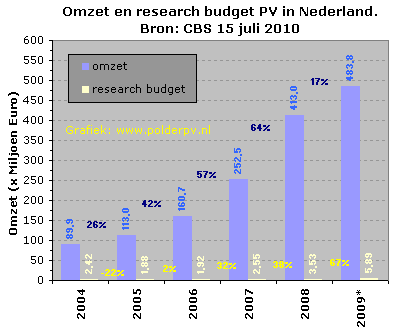
Fig.
CBS 8. Financial "results" from and in the PV sector in millions of Euro's
(one million = 1.000.000). In blue the annual turnover (in particular
revealing the effects of
the "interesting business
called
export yield
minus
cheap import cost"). From the May 12, 2009 report to the definitive
2009 CBS data published a quarter later, the turnover data for 2008
has risen from 382,3 to 413,0 million Euro, an increase of 8% (in app.
3 months
time),
most
likely to be attributed to the
strong
increase in the export data (Figure 7). Growth
percentages (Year On Year) have been given in between in dark blue
numbers. In particular surprising is the fact that after a few years "considerable" growth (mind you: in a very small "market"), increase
was only 17% in 2009, the second year that the new "incentive"
regime (SDE) was "running". Also from this graph it is evident,
that that regime is hardly effective for (financial growth of) the
PV-sector
- if at all...
In
light yellow columns the meagre budgets available/admitted to the
basic PV researchers in the Netherlands. Despite their fame (among
others,
ECN!),
they had to do with a minor sum: 3,53 million Euro in 2008, raised
67% (YOY growth percentages in yellow) to 5,89 million Euro in 2009.
9
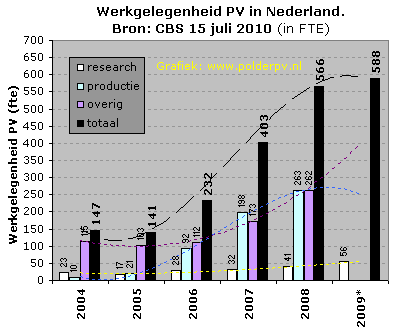
Fig.
CBS 9. Work
in PV in the Netherlands. Unity is "fte", which stands for "fulltime-equivalent",
or one full-week work. This stands for 38 hours in the Netherlands
(not necessarily one job, the Dutch have many split-jobs and/or part-time
jobs). Light yellow: research (most with ECN in Petten, TU
Eindhoven, University Nijmegen). Light blue: production. Mostly with
Solland Solar on the border with
Germany,
however 89 jobs were cut in August of crisis year 2009. Jobs
at the former Ubbink Solar Modules in Doesburg have also been lost
as a result of a
decision
by owner
Centrosolar
resulting from the Econcern bankruptcy crisis. Scheuten Solar in Venlo
is one of the bigger players in production, but number of employees
in the Dutch (Venlo) branch is unknown (most production workers are
in the Multisol® module factory in Gelsenkirchen and have to be allotted
to the German market). Purple: "other".
Perhaps related to the growing number of "new companies" offering
solar modules and/or systems to consumers and/or installers. Little
is known about many of
these newcomers, many of them 100% internet resalers.
Black columns are the
totals for the previous-mentioned three categories. 566 in the final
CBS report for 2008, increased to only 588 in the preliminary 2009
addition.
Regrettably,
most of the data for 2009 have not been given by CBS due to "secrecy"
clausules in contracts with the data providers. This, of
course, makes this kind of statistics grossly superfluous and without
any purpose. Polder PV tried to extrapolate the "trends" with a coarse
Excel-calculated 3rd degree polynome (dashed curves), giving a rough
indication what the spread in the results for 2009 could have been.
In view of the total number of fte's, only 22 more than in 2008 accumulated
in 2009 (hence: another "crisis
year" for PV sector in the Netherlands), it is most likely
that the biggest solar (cell) producer, Solland Solar, did not attract
many new jobs in 2009. It is expected that, in addition to the surprising
15 new
research
fte's
from 2008
to 2009, a few other "jobs" were with independent resalers,
many of which are not a member
of the
Dutch
branche
organisation Holland Solar.
Hence:
more
people
may be "involved" with PV, but they will probably not be
found in this very rough CBS statistic (the webmaster of Polder PV
and almost all
other PV website owners are also not represented, although it is
almost a full-time "job" here in Leiden) ...
588
fte's is a hell of a lot less than the app. 63.000 people working
in PV only in neighbouring world champion Germany (according to its
branche
organisation BSW, see pdf update for June 2010).
Discrepancy
between CBS and CertiQ data.
There
is a difference between the 2008 numbers from the CBS and the CertiQ
data
presented in the separate section (graphs).
It amounts up to 1,7 MWp, peanuts in international terms, however "considerable"
in the still small and permanently crippled Dutch market. There are several
possible reasons for this difference, strongly related to the disappointment
of
private
persons
and/or companies in the bureaucracy of the new SDE "incentive" regime.
Several individuals have openly admitted that, although they do have
obtained a "permit" for the SDE, they will not redeem it, still
buy solar panels, and will only have as a financial "incentive" the
net metering bonus (which is different for each household, depending
on the electricity
contract). Others did not even bother to apply for the SDE, bought a
system immediately, and are content that they have avoided lots of headaches.
This
trend has grown stronger in 2009, as massive amounts of SDE applications
haven been rejected due to ever-continuing state budget deficits (trend
alarmingly increased in 2010, when several ten-thousands of applications
were - or will be - rejected resulting from the application lottery...).
Again, this is best illustrated with the difference between the CertiQ
data and those of CBS. For 2009, CertiQ reported almost
6 MWp new "certified" (grid-connected) installations. CBS,
however, reported 10,6 MWp grid-connected
as being sold to installers in the Netherlands in that year (preliminary
data presented in this section). The difference,
approximately 4,6 MWp should represent grid-connected PV-systems
without application or approval under the SDE regime, and probably
not registered anywhere. It is possible, that, as ever more people
become
frustrated
by the
SDE
lottery, together with growing acceptance of solar electricity as a
viable alternative, that gap between the CBS and CertiQ will widen
in coming years.
Certified production
of photovoltaic electricity (PV) in the Netherlands (CertiQ data) status: end
of October 2010
see
figure captions for English explanation
Graphs (update
October 2010, download date November 4, 2010)
1
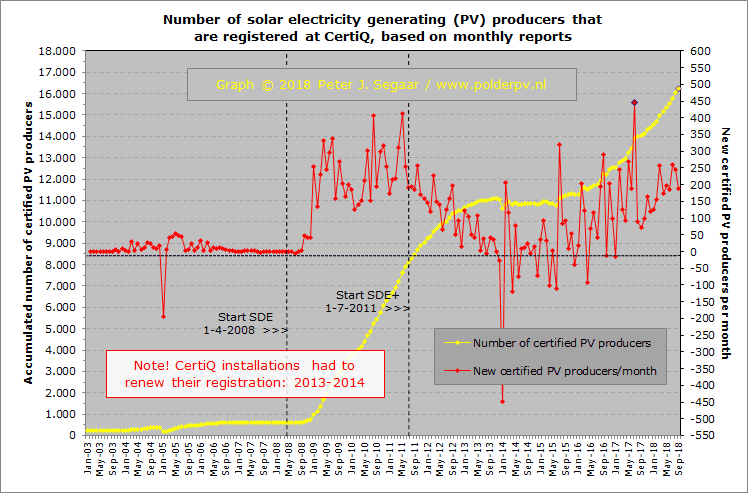
Figure
1. The accumulation of solar electricity generating
producers as registered at the national office of CertiQ ("certified
receiver of Guarantees
of Origin for proven production of renewable
electricity"), yellow curve (left Y-axis), and the calculated
(Excel) growth of the number of producers per month, red curve
(right Y-axis), respectively. The bizarre "dip" in the yellow
curve (Jan. 2005) is the result of a non-specified "market player" withdrawing
199 PV-installations from the GO administration (upon request
at CertiQ an explanation was not available). Only in the autumn
of 2008, half a year after
the start of a new "incentive regime" for renewable
electricity including PV ("SDE"), the number of accepted
GO receivers is starting
to grow again, apparently with strong growth. It should be reminded,
however, that as many as eight thousand applications
were approved in 2008, valid for 18 MWp (in 2008 only systems
were allowed in the range of 0,601 up till 3,5 kWp)
... In
2009 app. 2.500 new
applications for the category 0,601 - 15 kWp were approved in
August (a few applications still awaited approval at that time),
and only 70 for
the category > 15
- 100 kWp (both categories together maximized at 20 MWp). In
late November 2009 the green
light was given for a possible extra
850 "small" and 75 "large" 2009 applications
(not "new money",
but
shift in budget), respectively. All added together, total number
of approved applications (many of them still awaiting realisation...)
appeared to accumulate (January
2010 review) in 11.554 "small" and
128 "large" approvals
(max. 100 kWp installations allowed under the SDE regime...).
For
2010, the "small category" already received 17.000
applications on the very first day, and on June 1, 2010, it
became clear that only 4.200 of them will be/have been rewarded
with
a letter of approval after a third "lottery",
due to permanent State budget constraints (bulk of approvals
posted in June 2010). On that same day (May 31) it became apparent
that for the "large" category (>15 - 100 kWp installations)
35.000 applications arrived at the desk of the Agentschap NL
bureau. In September 2010, the horrible - but highly predictable
- news was published in
an ultra-short notice by the subsidy "provider" Agentschap
NL: For the small category only 4.200 of 17.000 applications
materialized in an official "You have a GO" letter,
the rest (almost 13.000 applications) had to be shredded
(24,7% "successfull application-by-chance", but not
yet "realisation").
Far worse, for the "big" category, only 131 of 35.000
applications were
"approved" after lottery conditions never heard of.
A lousy and exceptionally shameful "score" of barely
0,4%, generating bitter resentments among applicants and "potentially
interested" investors. Besides, with the note: the
lucky applicants mostly have not
yet
realized
their
plans, surprised as they may be by the sparsely provided green
light letters ...
At
the end of October 2010, including the 2008 and 2009 applications
the "CertiQ-registered
realisation" for these two SDE rounds still amounted to only 43,9
% of
the total number of approved project applications
approved sofar (if one already counts the approvals for SDE 2010
in the numbers, it is only 32,0%). No one knows the cumulative
number
of PV installations that have been realized
anyway, since a growing number of households avoid the lottery
and the SDE bureaucracy and still buy (albeit often relatively
small) PV systems. The exact number of installations, as well as
total new capacity realized, remains a mystery
since most
of these
smaller
systems
have
never been metered nor registered anywhere. For 2009, based
upon the data from CertiQ and by CBS (if correct), it must be concluded
that at least
40% of total
capacity "sold to end-consumers" is
realized outside the unstimulating national SDE regime.
Note:
Graphs are made by Polder PV from
publicly available monthly reports by CertiQ, the Dutch organisation
(part of main net manager TenneT) that controls certified production
of
renewable electricity. See the source
listing on the CertiQ website.
2
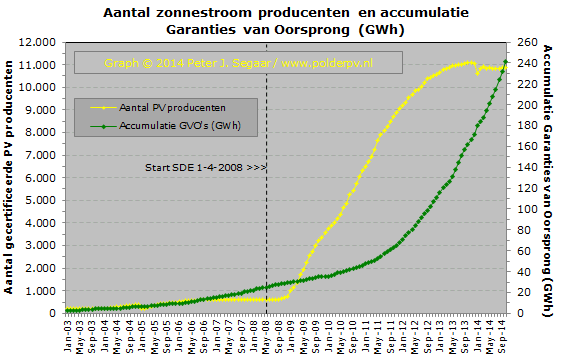
Figure
2. In this graph next to the accumulated number
of "certified" solar electricity producers (yellow, left
Y-axis), in dark green (right Y-axis) the accumulating number of issued
(proven
production) "Guarantees of Origin" is presented. It is important
to realize that each certificate stands for the production of 1 MWh,
which is
considerable because of the relative small PV-system sizes in the
Netherlands. Because only little production under the
new SDE incentive regime* has been realized
in two years time (e.g.: formally registered on a separate, certified
meter), there has been hardly any effect on the growth of the
certificates
issued,
despite the relative strong growth in the number of small (2008: system
maximization
3,5
kWp, 2009:
2
categories,
max.
15 or 100 kWp) certified producers. Strangely, after a flattening of
the curve at the beginning of 2010, the March report suddenly showed
a strong increase (app. 4,6%) in new certificates, continued later.
This "event" does not seem to reflect actual strong growth, but more
likely is to
be
contributed
to highly
discontinuous release policy of data by the net managers, and the actual
formalization of the related "green" certificates
by CertiQ. That process remains unclear.
*Open
since April 1, 2008, the then existing certified installations come
from
the previous "MEP" regime that was closed for new installations
in August 2006. Most approvals were issued after a long, 26 week waiting
period somewhere in the Autumn of 2008. Realisation however, is probably
only a third of the approvals issued (precise data are not known).
3
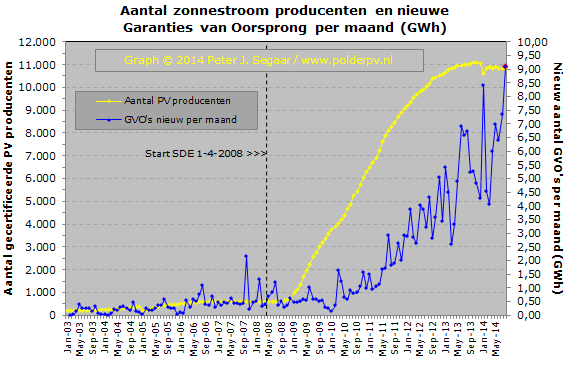
Figure
3. As in Figure 2, but now with the calculated new
Guarantees of Origin issued each month, blue curve (right Y-axis).
Season-related production originally was clearly recognizable in the
past, but later the graph becomes blurred, possibly by "lumping" of
GO's or administrative
procedures not
following the real production of the PV-installations involved*.
In this graph there has been only
a
weak, summer-season
(high production) related
effect
of the
growing
number
of registered and accepted GO receiving
producers of solar electricity as of the Autumn of 2008. Despite a fairly "large" number of newly registered (but small) PV-installations,
certificate production for solar electricity per month dramatically
collapsed
at the end of 2009/start of 2010, only reviving slightly in February.
March, surprisingly, showed a high release of new certificates that somehow
must have been accumulating in the previous period and that cannot be
related to actual (meagre) installation growth (the correlation between
the two curves shown here is almost absent). Also in April a "considerable" number
of certificates were issued, followed, however, by another dramatic decrease
in May and June. At the end of summer, finally, more GO's were
issued on a monthly basis.
Please
note that possibly 44
MWp (end of 2008 app. 34 MWp) of
mostly small (in the order of 0,4-3 kWp) grid-connected PV-installations
in the
Netherlands
is not represented
in
these graphs up till end of 2009, because they are not/never have been metered
nor accepted following the GO schemes of CertiQ or its predecessor
EnerQ...
* Actually,
production on which GO's will be based, is artificially evenly distributed
over the 12 months in the year by the net manager. Only after
the "level" of
1 MWh is surpassed, apparently one certificate is being validated
by CertiQ. Monthly reports of
production meter positions by the PV owner are not accepted
in the Netherlands, in stark contrast with Germany where PV system
operators
can bill
the net mananger for the legally fixed feed-in tariffs on a monthly
basis and physical production is known. The whole process in the
Netherlands is exceptionally unclear and entirely based on only one
measurement
in
the year,
which
can
be
done at any
moment to the liking (and/or business-model) of the net manager...
4
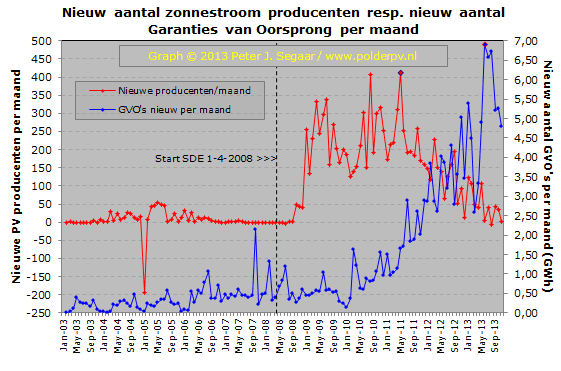
Figure
4. In this figure the number of
new certified producers of solar electricity per month is presented (calculation
from accumulated month values with Excel, red curve, left Y-axis),
and the number of new Guarantees of Origin
issued by CertiQ (idem, blue curve, right Y-axis). Again: as of yet hardly
any structural impact of the number of new producers on the GO's
actually issued (these are mainly issued for
the existing
producers from the old "MEP"
scheme or even older protocols). Just a moderate increase in new
GVO's issued/month is apparent since the start of the SDE on April
1 2008, although "output" fluctuates considerably (possibly
strengthened by pitfalls resulting from certificate issuing policy).
The trend was clearly downwards at the end of 2009, the
second year of the new SDE "incentive" regime. A hefty
"spike" for March 2010 comes as a surprise, as there
seems to be no direct relation with the level of newcomers with
certified
installations each month. The issue rate in April remained at a
relatively high level followed by another "dip" in May
to June. August remained relatively lax with certificates issued,
but a new record was given for new installation in the CertiQ administration.
However, any kind of correlation with new producers registered
with CertiQ seems to be almost non-existent, which is illustrated
by the incomparable trends in the two curves.
5
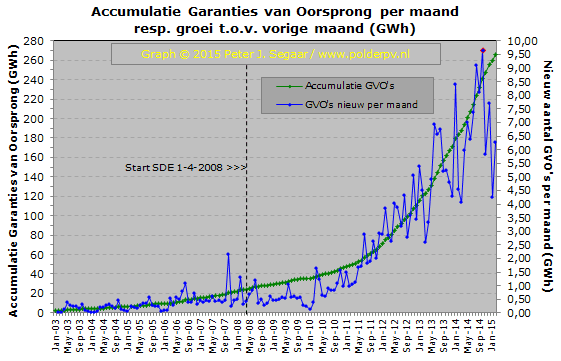
Figure
5. As in Figure 4, but now with the focus on the
accumulation (dark green curve, left Y-axis), and the new GO's issued
per month, respectively (blue curve, right Y-axis, unity GWh = 1.000
MWh = 1.000 certificates). For a long time, no dramatic, structural changes
were visible in growth (even flattening of the growth curve), despite
2 full
years of "new
incentive regime" [SDE
2008/2009]. Only March and April 2010 showed a distinct increase
in de certificates issued, also reflected in the accumulating curve.
The peak, however,
is smaller as the peak of October 2007, which appeared in
the middle of a factual "non-incentive" period for PV
in the Netherlands (since the previous regime, the "MEP",
was killed on Friday, August 18, 2006)...
6
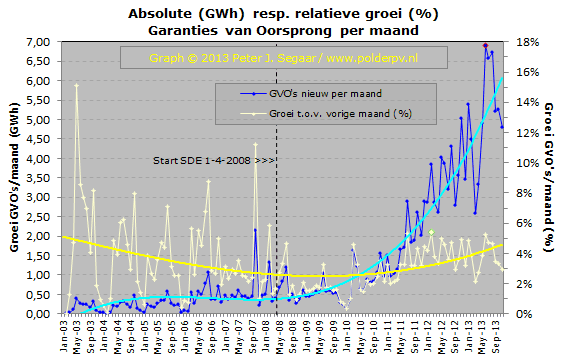
Figure
6. A somewhat clearer picture revealing "increasing
growth" for the number of GO's issued should become visible from
the relative growth
of the certificates issued in comparison with the previous month. Hence,
in this graph again the "newly issued per month" curve is presented
(dark blue curve, left Y-axis) in comparison with the curve in light-yellow
(right
Y-axis) that shows the relative percentual increase of the number of
GO's issued as compared to the previous month. If there would be a regularly systematic
issue policy of GVO's by CertiQ, based on physical monthly production,
this should immediately result in an increase of the yellow curve as
production
of
PV would start
to
take
off. This
clearly is not the case, as shown by the trendline (dark yellow). There
has been a significant upward trend in May >>>
June 2009, stabilizing after that period. The downward trend
in the second half of 2009 finally started to flatten out in early 2010
and showed good growth in March till April 2010. Growth up till now remains
lower than the average picture in the
years
2003-2006
(when
there
was
hardly
any incentive at all, the MEP scheme only yielded a meagre extra 9,7
eurocent/kWh on top of the net metering price, which was totally non-stimulating,
resulting in an almost dead market up till 2008). For clarity, a trend-line
for the "new GO's per month" curve has been added in light-blue
(Excel 3rd degree polynome). For months it showed a strong downward
instead of an upward trend
in the period in which a new "stimulation regime" was introduced,
even with the new "spike" in new certificates in March 2010.
Only in April-July 2010, two years after the start of the SDE regime,
the curve has been flattening out, and only in recent months it is beginning
to show a positive growth trend.
Accumulation
of certified photovoltaic installation capacity (STC)
Note
that X-axis and Y-axis change depending on report!
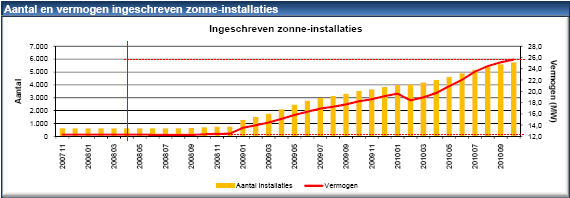
© CertiQ, October 2010 report, new style
2010:
February,
March,
April,
May,
June,
July,
August,
September
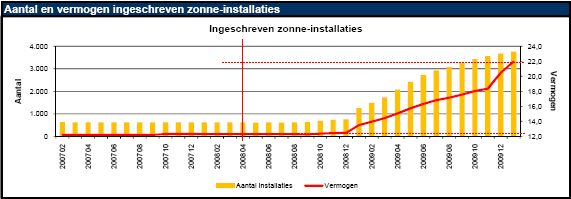
© CertiQ, January 2010 report, new style
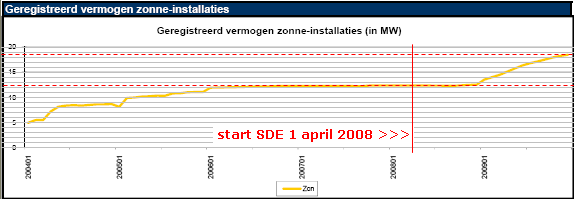
© CertiQ, December 2009 report
Figure
7. X-scale "old-style", lower graph,
running from start of 2004 up till end of 2009. Scale "new-style",
upper graphs, shifted to a starting
point
at February 2007 (Jan. 2010 report, 2nd graph from below), and
November 2007 (October 2010 report, upper graph). Note differences
in X-axis and Y-axis
ranges! These graphs come
from
the (actual)
monthly statistics pages on the CertiQ website. The old graph,
which was hard to read, has been slightly modified with a grid
and red lines by Polder PV to
clarify
actual
MWp increase. It gives the accumulated certified
PV capacity registered by CertiQ.
The upper horizontal (dashed) lines indicate the "accumulated"
nominal power as given in the month report illustrated (apparently
not always synchronous with the red curve - "Vermogen" -
in the graph). Since the years of immobility on a non-stimulated
Dutch
PV-market
only
some
growth
has become visible
again as of early 2009 (rise of flattened curve in the right part
of the graph, only 9 Months after the start of the SDE on April
1, 2008, vertical red line). Extrapolating the accumulation reached
December 2009 resulted in an estimate of some 6,3 MWp
of new
installations "accepted" by
CertiQ since the start of the new incentive regime (SDE) as of
April 1,
2008. In a later communication by CertiQ's owner TenneT it appeared
to have been 5,984 MWp for 2009 only, the year that most "SDE
installations" have been realized sofar (registered in the
CertiQ database)..
Very
strange
things happening. In
the official SDE incentive period (as of April 1, 2008) only 5.128 new
solar electricity producers have been certified/accepted by CertiQ
according
to their
published monthly reports up till
the end of September 2010. However, the actual "capacity accumulated" ("Vermogen")
mentioned by CertiQ and indicated in their published graphs sometimes
fluctuates in a very strange manner:
Month |
MWp
accumulation |
Difference
of
MWp accumulation related to previous month |
Difference
with MWp accumulation Dec '09 |
Dec '09 |
18,446 ¹ |
data
not available |
--- |
Jan '10 |
21,957 |
+ 3,511 |
+
3,511 |
Feb '10 |
20,784 |
- 1,173 |
+
2,338 |
Mar '10 |
18,316 |
- 2,468 |
- 0,130 |
Apr
'10
|
18,947
|
+
0,631
|
+
0,501
|
May
'10
|
20,013
|
+
1,066
|
+
1,567
|
Jun
'10
|
21,129
|
+
1,116
|
+
2,683
|
Jul
'10
|
21,947
|
+
0,818
|
+
3,501
|
Aug
'10
|
23,447
|
+
1,500
|
+
5,001
|
Sep
'10
|
24,123
|
+
0,676
|
+
5,677
|
Oct
'10
|
25,644
|
+
1,521
|
+
7,198
|
¹ Number
mentioned by press-officer of TenneT (CertiQ is a subsidiary of TenneT),
January 2010. Other data
in this column are from the monthly reports
in 2010. Numbers show MWp accumulation at the end of the month.
If the data in
the CertiQ reports are correct, we must conclude that in March 2010,
0,13 MWp of brand-new installation capacity reported to CertiQ
(via
misty
protocols)
suddenly
seemed
to have disappeared since the end of December
2009 (and even - 2,468 MWp related to the accumulation
reported for Feb. 2010...). While at the end of January
2010 there
should have been a "plus"
of
3,511
MWp. In April up till October there was again "growth",
albeit only at an average rate of app. 1,05 MWp
per month. End of October approximately
7,2 MWp of new certified grid-connected installations had accumulated for
the year 2010. That is over four times less capacity than
the average monthly
growth in Flanders up till October in the same year.
No explanation is given by CertiQ for these bizarre accumulation
numbers
sometimes going downwards instead of upwards while number
of installations at the same time show steady, slow growth.
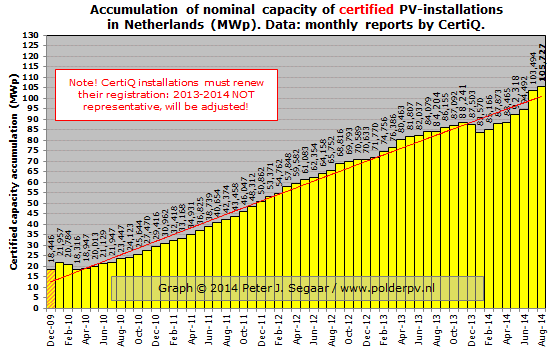
See also the graphs below, Fig. 7a:
|
|
^^^
Bizarre graphs made on basis of the monthly "accumulation" (in
MWp) of certified PV-installations in the monthly reports by CertiQ
(first
explicit report of capacity in January 2010). The data for December
2009 (hatched) is from an e-mail from the press officer of TenneT.
Instead
of growth of capacity, the CertiQ data seem to point to a (considerable) decline in
the months February-March 2010
which is a highly unlikely scenario. Maybe strange things are
happening with installations "approved
as certified", and despite their approval, possibly being
withdrawn again for unknown reasons. End of September 2010
accumulation was given by CertiQ as 24,1
MWp in accumulation, only 5,7 MWp higher than end of December
2009...
|
The 3,5 MWp of
installations that would have been added in the January
2010 report (36%
of
total
accumulation in 20 months), as well as the apparent "negative
growth" (?) in the months February and March
2010 were even more curious,
since
in these months the number of new installations has been growing like in previous
months, albeit in a modest tempo (see Fig.
1)!
If
one considers the new numbers in the September 2010 report as "correct",
the 4.828 new SDE installations (app. 12,2 MWp as interpolated
from the data published by CertiQ) would have an average nominal
(STC) capacity of app. 2,5 kWp. Note that an increasing number of
larger
PV-systems could have heavily influenced this outcome. Despite all
high-strung
political rhetoric concerning the "new" SDE incentives,
and a slight increase in pace, still not too many installations
have been realized under this "stimulation" regime,
only app. 161 on average per month in two years and six months
time. Because of the still small numbers,
every larger installation (max. 100 kWp under SDE conditions)
will have
a serious impact on the average system
size calculated. Polder PV expects that several larger installations
(15-100 kWp) will come on-line in 2010. See also this
webpage for a recent
example. Added to this Scheuten Solar put a 100 kWp installation
on their headquarters in Venlo, and an installation of app.
240 kWp has been realised in Sleen (Drenthe) on a new building
on the premises of a water purification
plant (however
only 100 kWp could be used under the allowance dating from
the SDE 2009 regime, short comment here). How many realisations
will follow in the present and coming years remains written
in the
stars.
More
curious
phenomena.
Despite the growth in newly admitted "SDE installations" (244
in May 2009), the total capacity in the certified scheme seemed to
have
become slightly lower in May 2009 (see image
by CertiQ), a possible error (?) by CertiQ since the resulting
small "peak" does not appear anymore in the June 2009
- and later - images. An earlier "dip" in the old graph
(2005) represented a bizarre and unspecified "withdrawal" from
almost 200 installations from the certified installation pool
in the
CertiQ database. It shows that even the CertiQ data remain exceptionally
unreliable and a bad marker for "proven PV market development" in
the Netherlands.
Note, again,
that the graphs presented above do not show
the "non-certified" PV-installations in the Netherlands.
Eur'ObservER estimated 58,4 MWp for on-grid systems in the Netherlands
for the end
of 2009 (the only category that matters with respect to "certification
protocols", see report ready for download on
this web page). CBS reported, however 62,5 MWp in accumulation
for grid-connected (year report 2009). Subtracting the approximately
18,4 MWp accumulated in the CertiQ database for
that year (according to spokesman of TenneT), there should
at least be
approximately 44
MWp
of non-certified
grid-connected PV installations in the Netherlands, if the above-mentioned
data are considered reliable (end 2009, factor 2,4 and a half more
non-certified
than certified installations). These PV-systems, including
the 1,34 kWp installation
of
the webmaster of
Polder PV,
have only "net
metering" [Dutch: "salderen"] as an incentive (mostly,
but not always, added to subsidies for buying the modules in old,
abolished incentive regimes
during
the first
years of the new millennium). There are also a number of installations
that never got subsidies of any kind, that only have net metering.
Examples: Niels
Thijssen from the northern part of the province of Limburg, Jeroen
Haringman in Hilversum with partially second-hand modules, Michael
Stegen's
impressive 5,4 kWp Sunpower installation, family
Konijn's huge 29,04
kWp installation in Purmerend, etc. An increasing number of PV-system
buyers (actual numbers unknown) avoid
the stifling SDE bureaucracy. Hence: not represented in the CertiQ
figures
or
databanks. Even worse: their production of renewable electricity
does not count in the official realisation of the "national
climate goals", which is absolutely bizarre considering the
deplorable status of the Netherlands with respect to actual production
of renewable
electricity.
Growth
of PV in the Netherlands in relative terms:
If correct, the roughly 12,2 MWp growth in the "incentive" period
April 2008 up till September 2010 (30 months,
status
according
to actual accumulated STC power mentioned, 24,123 MWp) suggests,
that on average approximately 407 kWp/month would
have been realized sofar (as registered
by CertiQ).
That remains an astonishing
low capacity growth for a stifling rich (and sunny) western country
such as the Netherlands with 16,6 million inhabitants and over 7
million households. The
comparable Belgium region of (Dutch-speaking) Flanders only (population
2,7 times smaller than the Netherlands) has
added 459 MWp in 25 months time,
hence on average over 18 MWp
a month since
April of 2008, a factor 45 times higher...
|
^^^
Bizarre grafiek ontleend aan de maandelijkse "accumulatie" (in
MWp) van gecertificeerde PV-installaties in de maandrapporten
van
CertiQ (januari 2010:
eerste vermelding). Het cijfer van december 2009 (gearceerd)
is ontleend aan een mededeling van de pervoorlichter van
TenneT. I.p.v.
groei van capaciteit lijken de CertiQ cijfers in de maanden
feb-mrt 2010 juist een (forse) afname daarvan
weer te geven, wat niet "kan" of "zou mogen" kloppen.
Eind
september 2010 was de accumulatie 24,123 MWp, 5,7 MWp hoger dan
die van eind december 2009. Ondanks
de lichte groei een blijvend povere prestatie voor het rijke
Nederland. Onvergelijkbaar met de buurlanden die als PV-kometen
voort blijven
scheuren met tientallen tot honderden MWp per
maand met nieuwe PV-systemen.
|
|
|
^^^
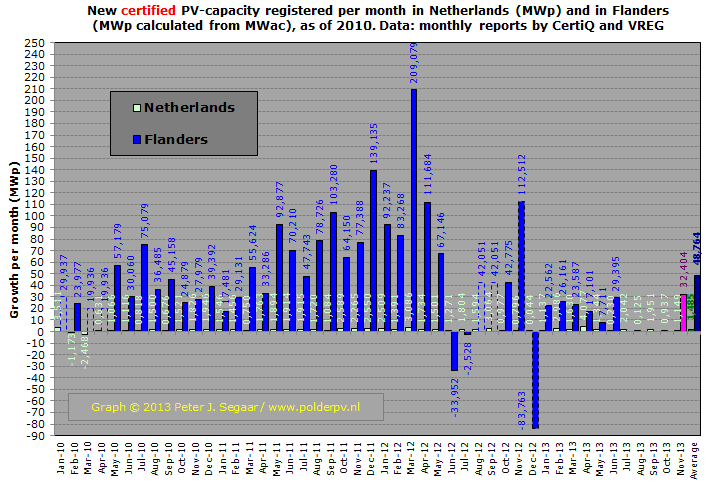
The
open columns with dashed blue rim are interpolations of the
month values considered for Flanders (Belgium) because VREG (for
a long
time with
structural
workforce problems) apparently has not always been able to publish
a report each month. Monthly growth in the Netherlands (as derived
from CertiQ
data) shown in
green columns.
Note
the considerable differences between monthly additions of
PV-capacity (MWp) in both PV-markets.
Also note: Flanders has a
population that is a factor 2,7 smaller than that in the
Netherlands. The
highly unlikely "negative growth rates" in
the Dutch columns for February and March 2010 have sofar
not been
commented upon by TenneT nor by
its daughter company CertiQ. Difference between monthly
additions of PV-capacities reported in Flanders and in
the Netherlands has been a huge factor 83 in
July 2010.
In
the last pair of columns in adapted colours the average
monthly growth has been given for both PV-markets.
Difference between
the two average numbers for monthly growth in 2010 is a factor 54 in
the advantage of Flanders.
|
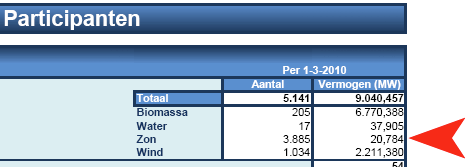
Nieuwe data in CertiQ rapport: geaccumuleerd vermogen
|
^^^
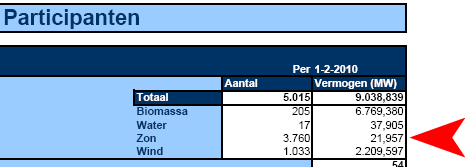
Screenshot of CertiQ January 2010 month
report. New is the actual nominal capacity registered ("Vermogen")
in MWp, 21,957
MWp for PV (red arrowhead). Much
more than could be expected from the December 2009 report and
recent comments by the press officer
from TenneT
(owner of CertiQ)... Average
system size of the 3760 installations in this report (note: including
old "MEP" clients such as 2,3 MWp Floriade roof and
674 kWp Ecopark Waalwijk!) is 5,8 kWp. See also screendump of
February 2010 report below!
Average
for this report's accumulation (old and new certified systems)
amounts to 5,8 kWp/installation. Note that old installations
like Floriade 2,3 MWp and 674 kWp Ecopark Waalwijk are among
them...
|
|
^^^
Screenshot of CertiQ February 2010 month
report. Suddenly, the actual nominal capacity registered
("Vermogen")
in MWp, has dropped from the 21,957 MWp in
Januari (see graph above) to the present 20,784
MWp for
the 3.885 "certified" installations accumulated sofar (red
arrowhead). No explanation has been given for this unlikely
"negative growth
scenario"
under
a
new "incentive" regime...
Average for this report's accumulation (old and new certified
systems) amounts to 5,3 kWp/installation.
|
Yearly
CertiQ data (from month reports)
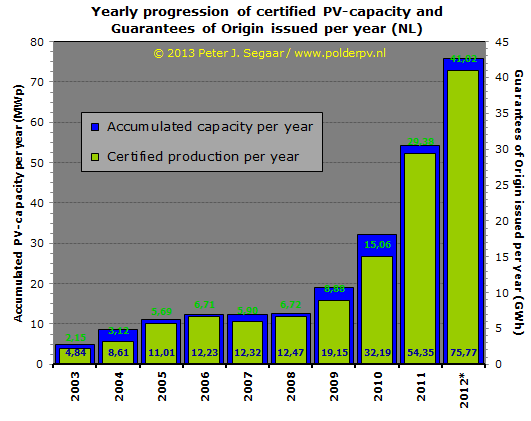
Figure
8. Results of CertiQ monthly reports lumped into data per
year and, in dashed columns at the right, average of the period under consideration
(2003-2009). Data status: January 2010. On the left Y-axis the number of
new certified PV-installations per year resulting from subtracting the
accumulation
of
installations in
the December reports (data valid as of January 1 of each year), columns
in blue. On the right Y-axis the number of Guarantees of Origin (GO's)
issued by CertiQ for the year under consideration (1 GO stands for 1 MWh,
1.000 for 1 GWh). Data obtained by extracting the accumulated GO's issued
in the December reports; green columns. Note the many new PV-installations
in
2009, resulting from a new but bureaucratic subsidy regime (started on
April 1, 2008). These are, however, mostly small systems of max. 2 kWp.
Impact
of the installation growth on GO's issued is hardly discernable, even
in
2009.
This probably
is the
result
from delays
in certificate
validation
for
that
year, and the fact that small installations need a long time before even
one certificate (= 1 MWh) can be accounted for by CertiQ. Note that growth
of certificates issued already started two to three years before the new "incentive regime". It is most probable that for the year 2009
CertiQ will register more GO's, accumulated as net managers file their
interpolated "monthly production" based on one measurement in
a one-year period.
Note that despite
the enormous "boom" in new PV installations in 2003 (see CBS
data elsewhere on this web page), almost none of these installations
have been recorded as "certified" in the CertiQ database.
Feiten
update maandrapport
1-9-2010 (overzicht september 2010,
download van CertiQ site dd. 10 oktober 2010)
- Aantal
zonnestroom producenten geregistreerd bij CertiQ: 5.444 (augustus
2010: 5.251).
- Vermoedelijk
aantal SDE klanten: 5.444 - 616 (aantal bij CertiQ ingeschreven
installaties direct voor de start van de SDE 2008) = 4.828 (88,7%
van totaal; augustus 2010: 4.635)***.
- Bijgekomen
t.o.v. vorige maand: 193 stuks (augustus
2010: maand"record" onder SDE condities,
406). Let wel, in Vlaanderen is die volumegroei
gemiddeld ruim 3.300 installaties per maand gedurende het laatste
anderhalve jaar...
- Groei
t.o.v. vorige maand: 3,7% (in
augustus 2010 was die groei: 8,4%).
- Percentage
geaccumuleerde aantal SDE producenten t.o.v. referentie van in 2008
aantal door - destijds - SenterNovem beschikte aanvragen (8.033 stuks
voor
dat jaar) zou zijn geweest: 60,1% (in
augustus 2010 was dat: 57,7%).
Aangezien elke volgende maand met zekerheid steeds meer SDE 2009
klanten het "CertiQ [publicatie]
stadium" zal hebben
bereikt, en waarschijnlijk inmiddels ook alweer SDE 2010 klanten
in de CertiQ cijfers opduiken, klopt deze berekening
echter
van geen kant meer: zie daarom nieuwe berekening onderaan.
- Cumulatieve
hoeveelheid door CertiQ uitgegeven GVO's zonnestroom sinds 1 juli
2001: 42,602 GWh (in
augustus 2010 was dat: 41,772 GWh).
- Daarvan
is 10,098 GWh voor
"eigen gebruik" toegekend en 32,504
GWh is "bewezen" (bemeten) ingevoed
op het distributienet (verhouding 23,7% resp. 76,3%).
NB: het door CertiQ vastgestelde percentage "eigen gebruik" groeit
al sinds de start van de registraties in maart 2009: toen was
het
nog
slechts
17,0%. Dit heeft mogelijk te maken met het feit dat bij mensen
met Ferrarismeters alle geregistreerde opwek (bruto productie
meter) fictief als "eigen verbruik" wordt gezien (wat natuurlijk
niet de realiteit is) cq. als zodanig
wordt "toegekend".****
- Gemiddeld
zijn er vanaf 1 januari 2003 tot 1 april 2008 (start SDE) 6 nieuwe
zonnestroom producenten/maand geregistreerd bij CertiQ (groeipercentage 2,1%/maand).
- Gemiddeld
zijn er vanaf 1 april 2008 (officiële start SDE) 161 nieuwe
zonnestroom producenten/maand geregistreerd bij CertiQ (groeipercentage 7,9%/maand).
- Bovenstaande
getallen waren voor augustus 2010 nog 160 resp. 7,8%/maand.
- Eind
september 2010 was de totale geaccumuleerde gecertificeerde PV-capaciteit
in Nederland volgens het maandrapport 23,447
MWp (eind augustus volgens opgave CertiQ: 24,123
MWp).
Een groei van 676 kWp in een maand tijd (22 kWp/dag, grofweg
109 modules van 200 Wp per stuk). In januari 2010 zou er volgens
de
maandrapportage nog 3,5 MWp in
1
maand tijd
zijn
bijgekomen (op
basis van een mededeling van de persvoorlichter van TenneT over
de capaciteit toename in 2009 en de status eind
december van dat jaar: 18,446 MWp). Waarna er weer iets van 2,5
MWp verdwenen zou zijn in de maanden feb.-mrt. (veel onduidelijkheden
hier).
- In 2009
is 43% van de totale "afzet aan eindgebruikers" (CBS cijfers) buiten de SDE om, en dus ook buiten de CertiQ registraties
om gerealiseerd. Zie detail analyse van CBS jaarcijfers voor PV in
Nederland van 2009, bericht
van 21 juli 2010.
- Nieuw
geregistreerde capaciteit in september 2010: 24,123 - 23,477 = 0,676
MWp (22,5 kWp/dag). Dat was in augustus 2010 nog 1,5
MWp (48,4 kWp/dag).
- Uit groei
aantallen installaties en groei capaciteit in september 2010 volgt
een gemiddelde nieuw bijgeplaatste systeemgrootte van 676 (kWp)/193
(nieuwe PV-systemen) = 3,5 kWp/installatie.
- Volgens
de gegevens in de CertiQ maandrapporten was de gemiddelde
nieuwe systeemgrootte tussen
1 januari en 30 september 2010 3,04
kWp/installatie.
- Gemiddeld
zijn er vanaf 1 januari 2003 tot 1 april 2008 (start SDE) 347 nieuwe
GVO's/maand geregistreerd bij CertiQ (groeipercentage 3,8%/maand).
- Gemiddeld
zijn er vanaf 1 april 2008 (start SDE) tot en met september 2010 621 nieuwe
GVO's/maand geregistreerd bij CertiQ (groeipercentage 1,9%/maand).
- Bovenstaande
getallen waren voor augustus 2010 nog 614 resp. 1,9%/maand.
- Nieuwe
berekening door
totstandkoming van de nieuwe populatie "SDE 2009 beschikten" (aanpassing
van bericht medio
augustus in bespreking beschikkingen
lijsten SDE 2008/2009): 3.521 "klein" plus
128 "groot" =
3.649 totaal.
In totaal zijn er nu volgens de laatste cijfers 11.682 zonnestroom
aanvragen (SDE 2008 + 2009) "beschikt" (SDE 2010 is pas
vanaf eind april 2010 qua toewijzingen [categorie "klein"]
op gang aan het komen, is nog weinig van bekend). Van deze hoeveelheid
beschikkingen
is
met
de CertiQ cijfers voor september 2010 voor
de SDE 2008-2009 nog steeds slechts 41,3% ingevuld
(60,1%
als alleen van SDE 2008 uitgegaan zou worden, wat echter door de
"vervuiling"
door de ook meegetelde latere beschikkingen
vanaf 2009 geen realistisch percentage meer
is). De verwachting is dat dit percentage sterker gaat stijgen
zodra de eerste grotere
aantallen SDE
2009
beschikten
daadwerkelijk
werkende
bruto
productiemeters in
de meterkast
gekregen zullen hebben, het hele administratieve circus tussen netbeheerder,
CertiQ en
SenterNovem Agentschap NL hebben doorlopen,
en uiteindelijk als "geaccepteerd" in
de database van CertiQ zullen zijn of worden opgenomen. Vooralsnog
blijft zelfs die groei nog steeds aan de lage kant. Ook moet
rekening gehouden gaan worden met in de aantallen op te nemen
installaties die reeds eerder dit jaar zijn beschikt voor SDE
2010, en die mogelijk ook al bij CertiQ zijn geregistreerd. Een
zo'n
installatie,
een
fraai monokristallijn 8,14 kWp systeem, werd eind augustus
2010 openbaar
gemaakt. Als de netbeheerder een beetje heeft voortgemaakt
met de bruto productiemeter, zou het systeem inmiddels bij CertiQ
aangemeld moeten kunnen zijn.
De vraag
is ook
of
de SDE 2008
verder nog fors
zal groeien
qua daadwerkelijk
ingevulde
aanvragen. De inschatting van Polder PV is: die 8.033 beschikkingen
gaan zeker nooit allemaal worden ingevuld, zelfs al melden zich
af en toe nog steeds sommige
"beschikten" die alsnog hebben laten installeren
(of het zelf hebben gedaan). Mogelijk gaan er een paar duizend
van die met absurd veel moeite tot stand
gekomen
beschikkingen
verworden tot een waardeloos vod papier waar niet meer naar
wordt omgekeken en ergens in een bureaulade liggen te verstoffen.
Formeel hebben de indieners
voor SDE 2008 4 jaar tijd voor invulling na toekenning van de
beschikking
(dus ongeveer tot oktober 2012), voor SDE 2009 en 2010 aanvragers/beschikten
is dat teruggebracht naar anderhalf jaar. SDE 2009 aanvragers hebben
dan tot ongeveer februari 2011
de tijd voor daadwerkelijke realisatie (afhankelijk van exacte
datum van de beschikking, en eventuele eenmalige door Agentschap
NL geaccepteerde verschuiving van de realisatie datum). Gezien
het feit dat SDE 2010 beschikkingen vanaf ongeveer eind april uitgegeven
blijken te worden (categorie "klein"), zouden
de eigenaren daarvan tot ongeveer eind oktober 2011 tot invulling
over moeten
gaan om nog binnen de realisatie periode te blijven (het grootste
deel zou volgens zeggen van Agenstschap NL in juni 2010 uitgegeven
moeten
zijn).
De paar beschikkingen (131 stuks uit de stortvloed van op 31
mei 2010 binnengekomen 35.000 aanvragen) voor categorie SDE
2010 "groot" zouden
mogelijk op zijn vroegst ongeveer begin augustus uitgegeven
kunnen zijn, etcetera: Het
wordt
allemaal een ongelofelijk complexe warboel om de "invulling"
van de beschikkingen uit verschillende jaren te volgen.
- Voor
verdere info over het SDE jaar 2009, zie ook de aparte
pagina met o.a.
uitvoerige bespreking van de oorspronkelijke en gereviseerde CertiQ
jaarrapporten en de jaarverslagen. En enkele artikelen op de website
Duurzameenergiethuis.nl met enkele
destijds nog niet bekende
marktdata.
Het
bij CertiQ
ingeschreven gecertificeerde vermogen was volgens de persvoorlichter
van CertiQ eigenaar TenneT
in 2009 gegroeid van 12,462
naar 18,446 MW, dus 5,984
MWp in een jaar tijd. Dit zal waarschijnlijk nog steeds niet het
fysiek netgekoppelde (SDE) vermogen blijken te zijn in dat jaar,
gezien de lange administratieve weg tussen
plaatsing van de bruto productiemeter en het felbegeerde (?) vinkje
in de CertiQ database. Er kunnen dus nog met terugwerkende kracht
nog steeds systemen bij komen, al is nog niet te voorzien hoeveel,
en wanneer die bijschrijving dan wel officieel "beeindigd" zou
gaan worden. Sterker nog, het is ook nog steeds mogelijk dat het
geaccumuleerde vermogen van 2008 aangepast wordt, waardoor het totale
volume voor 2009 nog steeds niet definitief is vastgesteld (zie de
aparte pagina voor detail
analyse).
Deze typische, "grillige"
en blijvend teleurstellende Nederlandse cijfers altijd in gedachten
houden als u de recente, volledig gedocumenteerde marktgroei van de oosterburen
in
beschouwing neemt: 2008 >1,9
GWp;
2009 3,8
GWp; alleen al het "slechtste" eerste kwartaal 2010 alweer 715
MWp, de eerste acht maanden inclusief record maand juni (2,1 GWp) in
totaal alweer
4,9 GWp (voorlopige data Bundesnetzagentur).
Goed voor (status 2009
marktprognose BDEW, pdf, mogelijk zwaar onderschat vanwege explosieve
eindejaar-spurt met nieuwe capaciteit in BRD) 5.616 GWh op jaarbasis,
wat neerkomt op ongeveer
468 GWh gemiddeld per maand nieuwe opwek aan zonnestroom.
Dat is ruim 11 maal zoveel nieuwe Duitse fysieke zonnestroom productie
per maand als er
totaal
in
de Nederlandse certificatenregeling is geaccumuleerd sinds
juli 2001... NB: de feitelijke totale zonnestroom productie in Nederland,
inclusief de talloze niet gecertificeerde installaties, is een groot
mysterie,
ondanks extreem speculatieve cijfers van het CBS daarover (natter vinger
werk is haast niet mogelijk). Zie daarvoor mijn kritische kanttekeningen
bij de CBS cijfers
elders op deze pagina.
*** Berekend
door het aantal geaccumuleerde GVO producenten door CertiQ geregistreerd
aan het eind van de besproken maand af te trekken van het aantal geaccumuleerde
producenten geregistreerd eind maart 2008 (vlak voor start SDE 2008
op 1 april van dat jaar). Deze berekening kon alleen maar redelijk
"safe" gedaan worden totdat de impact van de SDE 2009 daadwerkelijk
bij CertiQ gestalte ging krijgen. Aangezien pas eind juli 2009 de
(in totaal 3.649) beschikkingen voor in 2009 gedane aanvragen
uitgegeven zijn, en er nog steeds lange wachttijden zijn bij de netbeheerders
voor het plaatsen van bruto productiemeters, zouden zelfs de reeds
na 6
april
aan het net gekoppelde nieuwe systemen onder die regeling nog minimaal
een maand hebben moeten wachten voordat ze waarschijnlijk een in werking
gezette bruto productiemeter hebben. Vanaf dat moment is het natuurlijk
een warboel
geworden met de cijfers, want toen gingen verschillende SDE
beschikkingen
(met
elk weer
onvergelijkbare categorieën) volledig door elkaar heen lopen,
ook bij CertiQ. Vanaf dat moment (??? augustus-september 2009 ???)
kan er dan ook alleen maar gekeken worden naar
de "accumulerende impact" van de SDE regeling, niet meer
naar het effect van elk jaar, omdat de cijfers daarvan niet bekend
zijn (die liggen
bij Agentschap NL/SenterNovem en lijken niet te worden vrijgegeven).
Op
1 maart 2010 is de derde SDE ronde (vertraagd) ingaan en direct massaal
overtekend, te beginnen met de "categorie klein" (gecapt op het traject
1,0 tm. 7,5 kWp). Voor de "grotere" projecten
kon pas vanaf 31 mei 2010 worden ingetekend, en dat werd op
gigantische schaal gedaan met 35.000 aanvragen, waarvan er slechts
131 stuks "mogen" doorgaan... Vanaf eind
april 2010 (eerste beschikkingen verstuurd door
Basic information:
CBS data and monthly reports on website of CertiQ
http://www.cbs.nl
http://www.certiq.nl/ (Cijfers
en overzichten >>> Statistisch overzicht CertiQ)
CertiQ year
report for 2009, see separate
webpage.
Other
references
http://www.solarbuzz.com/EUE09.htm
Disclaimer. Graphs
and data presented on this page and the website Polder
PV do not
have a legal status. Please refer to the original sources for
clarification.
This information page is part of a non-commercial private undertaking
to enhance public awareness of national and global development in the
solar energy industry. Please contact the webmaster if you want to
use the graphs made by him from the raw data.
Updates:
7
mei 2009, 12 mei 2009 (incl. voorlopige CBS cijfers 2008), 5 juni 2009,
6 juli 2009, 5 augustus 2009, 3 september 2009, 18 september 2009 (definitieve
CBS
cijfers 2008), 25 september 2009 (foutje hersteld), 7 oktober
2009, 5 november 2009, 4 december 2009, 6 januari 2010, 15 januari
2010, 3 februari 2010, 9 maart 2010, 27 april 2010, 21 mei 2010, 26
juni 2010, 8 juli 2010, 21 juli 2010 (update CBS data sectie 1 op deze
pagina, stand 2009 "voorlopig"), 9 augustus 2010 (CertiQ
update juli), 6 september 2010 (CertiQ augustus), 28 oktober
2010 (CertiQ september).
|
