
growing
like nuts
| |
|
||||||
|
growing
like nuts |
index | ||||||
|
|
|
|||||||||||||||||||||||||||||||||||||||
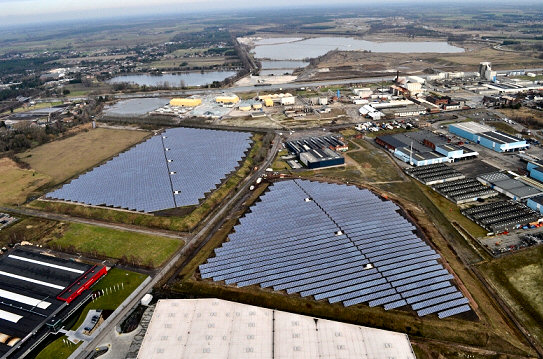
Summary according to VREG registrations*: Milestones March 2011: 100.000 PV-installations in Flanders surpassed. Biggest free-field PV-installation of Benelux included (2x 6,2 MWac Nyrstar project). Accumulated capacity up till December 31, 2010, according to latest month report revision (status: Apr. 5, 2011): 726,948 MWac with 96.609 registered "installations"**. Accumulated capacity up till latest month report, April 5, 2011: 747,294 MWac with 100.935 registered "installations"**. Market
growth January 1, 2011 up till April 5, 2011: Difference between latest Apr. 5, 2011, and previous Feb. 28, 2011 report: 3.575 registered entries with 50,567 MWac (app. 11,2 MWac extra attributed to 2009, app. 25,4 MWac extra to 2010). Accumulated capacity end of 2009 (VREG update/review April 5, 2011***): 534,895 MWac with 65.248 registered entries (average size all installations: 8,20 kWac/entry). Preliminary market growth for 2009 - based on new numbers published by VREG, Feb. 28, 2011 (dramatically increased with respect to 2009 year report published May 2010), and continuously revised in later reports (status: Apr. 5, 2011): 442,059 MWac with 49.897 "installations" (average size new installations 2009: 8,86 kWac/entry). Preliminary, calculated market growth for 2010 (Jan. 1, 2010 up till Jan. 1, 2011): 192,053 MWac with 31.361 registered entries (average size new installations 2010: 6,12 kWac/entry). Total growth in period 2009-2010: 634,112 MWac with 81.258 registered entries (further increase expected with backlog being registered in future VREG reports). Serious downfall of newly added registrations in January 2011 for >10 kWac category: only 8 (1,418 MWac new). In February 28, 2011 report "revival" with 54 new in this category (9,490 MWac), in April 5, 2011 report 115 were added (33,391 MWac). Installations with a capacity of max. 10 kWac registered by VREG make up 58,5% of the (documented) Flemish PV-market and have an average size of 4,40 kWac. 1.589 installations registered with VREG have an inverter capacity > 10 kWac. The biggest "single-site" installation is the multi-roof Loghidden City terminal of Katoen Natie (Schelde West Bank) with at least 27,51 MWac inverter capacity. Heusden-Zolder 4,704 MWac Zonnecentrale Limburg NV, for a long time the largest free-field installation registered as such by VREG, has been replaced by 2 preliminary large entries for Zonnecentrale Overpelt NV in the April 5, 2011 report. These entries probably represent a solar parc over 12,4 MWac in size. By far the largest in the Benelux. * Note that a considerable volume of registrations in 2009 seems to have been attributed to a large contingent of installations at the end of 2009 with the modules already fixed in place, but that were given time up till end of February 2010 to have inverters installed and a certified installation connected to the grid (these installations all get 45 eurocents/kWh for the green certificates, all other grid-connected PV-systems in 2010 "only" 35 eurocents/kWh). If one would take "grid connection of a complete installation" as the decisive point in time, these PV-systems were "formally delivered" in 2010, not in 2009. Apparently VREG decided otherwise, or regulations were not clear on this important point. The "choice" to allocate such a large volume to either the former or the later year has, of course, huge impact on "officially newly installed" capacity in a certain year, such as incorporated in national (Belgium) and international (e.g., EurObserv'ER, EPIA, etc.) statistics. ** Certified, registered with VREG, and prone to receive green certificates for the electricity produced. Note, that many several larger PV-systems are not reported "as one system", but as two or more separate entries in the VREG registrations. The biggest "multi-roof" installation on one site, the huge Loghidden City Complex on the western Schelde shore (Kallo Kieldrecht), and part of the 40 MW Katoen Natie super project, has been split into at least 22 separate parts (varying in size between 210 and 1.804 kWac in the VREG reports) filed under the name of several daughter companies of the Katoen Natie holding (status: Apr. 5, 2011). Similar split-ups appear in the Desteldonk area of Gent for the Katoen Natie project, and are frequently encountered with a variety of other bigger installations of hundreds of kWac. In the VREG reports, the "entries" are referred to in Dutch as "productie-installaties" (installations for production of renewable electricity deemed worthy of receiving guarantees of origin). *** Still not definitive numbers, data can - in particular for most recent years will - change in coming year report(s). |
Results from the market statistics produced by the "Vlaamse Reguleringsinstantie voor de Elektriciteits- en Gasmarkt" (VREG) for PV market development in Flanders. Statistics are frequently refreshed on VREG's website, but sometimes lagged behind 1-2 months due to serious work overload at the regulator's office (since April 2010 there has been, however, a continuous update per month). It must be emphasized here that older "numbers" reported by VREG can still be updated afterwards, as can be found in the [updated] year reports by the regulatory authority, and also, since 2011, in extensive, updated month reports. Hence: earlier published year accumulation for PV-capacity, can be changed as a backlog of installations not yet covered for that year is added even years later. This was particularly so for the data for 2009, that VREG first revised officially in their Feb. 28, 2011 month report (dramatically increasing capacity and installation numbers for 2009 compared to the 2009 year report). This realisation made Polder PV update his earlier data on basis of VREG's yearly reports, and update his graphs published sofar. Updates will be further provided with each month report.
Graphs made by Polder PV from the principal VREG data (and other sources) are found directly below (roll-over image). Data for earlier years (up to 2004 from graph published by ODE, this webpage) have been replaced by new VREG data published in the Feb. 28, 2011 report. The latter report is now the first reference for new analysis, which will be augmented by new data in monthly reports as of March 2011. Note: data in these graphs are only for the "Vlaamse Gewest", the Flanders territory excluding Brussels, and also not including the large French speaking Walloon region. See the separate sections for these areas on this page. These data for the much smaller Belgium markets still have to be updated. An analysis with most recent data (but with the older, "then latest available" VREG data for Flanders) has been published by Polder PV in an article published for the 2010 Solar Future Belgium symposium by SolarPlaza (original article here).
MWac, not
MWp
Note
that data published for the Belgium market appear to relate to maximum
inverter capacity
involved (kWac), and do not refer to nominal STC power of the DC generator
(kWp), as previously thought. Polder PV, on asking VREG, what accumulated
MWp power could be on Flemish soil, got the reply that this is unknown
for many older installations, and that such data have not yet been compiled
by the regulator. A "standard calculation factor" to obtain MWp
power from the registered MWac data is not used by VREG because of the
uncertainties
therein (e-mail
reply March 8, 2011). If one would calculate in a conservative manner,
one could multiply the AC power in the tables and graphs with a DC generator:AC
inverter capacity factor 1,1 (hence: on April 5, 2011, Flanders could
have accumulated 747 (MWac)
* 1,1 = 822 MWp of nominal DC power (STC capacity of PV-modules involved).
This remains, however, an uncertain value as long as VREG is unable to
provide more details.
For population data (mid 2010), the number of inhabitants for the Vlaamse Gewest only has been taken ("Vlaamse Gewest" app. 6,3 million, "Vlaamse Gemeenschap" including Brussels would have app. 7,2 million Flemish inhabitants, according to this Wikipedia site). Data for Flanders are compared with data available for the Netherlands in the graphs. For further information please contact the webmaster of Polder PV.
Total
market growth for Flanders in 2009
New calculations had to be done based on the new
data published by VREG in their February 2011 report and later
revisions. Originally, VREG, published a volume of 245,051 MWac
and 47.273 new installations
for 2009, in their year
report for that year (dated May 2010). This has been grossly adjusted
in the new data. This is probably the result of the fact
that many installations have been mounted end of December
2009 without inverters, for which two months extra time in 2010 was
given by the Flemish authorities ("transition period").
This to the effect of finalizing the installations and be able to
apply for the "old"
45 Eurocents per kWh (green certificates value), instead of the 35
Eurocents that was valid for all other new installations as of Jan.
1, 2010 (up till the end of that year). Possibly VREG originally
counted
(part of) those installations finalized before end
of February
2010
as belonging to the "2009 cohort".
The latest VREG numbers in the Apr. 5, 2011 year market update are: 49.897 new installations in 2009 (5,6% over the year report 2009 value), and a respectable 442,059 MWac of new capacity (80,4% over the previously reported volume in the first year report...). That is roughly a factor 74 as much as the absolute "growth" in DC power for PV (2009, data CertiQ) for "certified PV-installations" [app. 6 MWp], and 41 times as much as the total new capacity sold in 2009 (10,7 MWp) according to the most recent CBS statistics in the Netherlands bordering Flanders in the north.
Previous
estimates
In
an article in February 2010, Photon International claimed a capacity
of 275
MWp (DC generator capacity) for the whole of
Belgium in 2009
[PI issue 2-2010], which appeared to be highly underrated since
the Walloon region and Brussels should be counted on top of the
VREG adjusted
431
MWac for
Flanders only. In
another article, published by the German Photon equivalent in
the September
2010 issue (see also electronic
version), it was suggested, based
on sources with the Flanders branch organisation BelPV, that
a
new
capacity of 301,8 MWac could have been added in
2009.
And that in the whole of Belgium 345,2 MWac
would have been newly built in that year. In
a short message in the first Photon magazine of 2011 (January issue,
p. 13), mentioning "only
105 MW growth" for
2010 (most probably AC power), they referred to VREG and stated that
it might have been even "four
times more" in 2009, suggesting a volume of app. 420 MWac for
that year.
Finally, in a short article published on December 30, 2010, on the Dutch website Energeia, a Belgium reporter, Koen Mortelmans, cited BelPV with new numbers for Flanders in 2009: 412 MW (most probably AC power), also citing that in the first 11 months of the following year 2010 "only 100 MW" would have been added, while a small end-of-year-rush could result in an extra 80 MW (hence: expectation of only 180 MW new capacity in Flanders for 2010 by BelPV). These volumes had been re-adjusted to 412,7 MWac for 2009, and 165,0 MWac for 2010 in a graph in the "Marktcijfers PV" overview by BelPV (February 2011).
All these estimates - that now all appeared to be on the (very) low side - show that it remains difficult to obtain a reliable picture of ultimate market realisation, and that in the end market growth in Flanders seems to have been bigger than expected even by well-known PV-market analysts. With the important notice that VREG still can adjust their latest data, like they have done in previous year, and now also monthly reports. These adjustments always were in a positive direction: more installed capacity than previously published.
In the graphs presented below I will first give the latest year results (or: predictions) up till 2010 from the most important sources for the Flemish market: regulator VREG and branche organisation BelPV. All graphs give AC power of installations (note: deviating from common practice in Germany, where DC power capacities are published, "Generator Leistung" in kWac, MWp, etc.).
 |
ROLL-OVER IMAGE. Mouse pointer away from the image shows the most recent available data from VREG (revised year data renewable electricity generation capacity as of Apr. 5, 2011). Mouse pointer over the image shows the previous data from year report 2009 and monthly updates up till Jan. 2011. For 2009/2010, changes are remarkable. Apparently the "end of year rush" installations in that year, that were officially allowed being certified as "connected tot the grid" as late as end of February 2010, have now been allocated to the year 2009 (instead to 2010). Hence, the 2009 year report capacity data will probably be revised as such in the coming 2010 year report. Note that capacity is in AC power (maximum inverter power of the installations involved). Total installed nominal generator power (MWp STC tested power of all PV-modules) is as of yet unknown for many older installations by market regulator VREG, but could conservatively be taken as 1,1 times AC power. |
Yearly added new PV-capacity (grid-connected) in Flanders completely revised by VREG, in their February 28, 2011 month report (mouse pointer away from graph). The changes with respect to previous known numbers (mouse pointer over the image) are staggering for the year 2009: Following data from the year report 2009, VREG originally published preliminary new capacity of 245,1 MWac for 2009. This has been changed into a considerable higher 430,8 MWac in the Feb. 2011 update (76% more capacity than previously published). In the April 5, 2011 report (not shown here), it was further extended to 442,1 MWac. The originally calculated new capacity for 2010, 320,1 MWac, followed from the monthly reports published in 2010, but had to be revised accordingly: the preliminary new capacity for that year in the April 5, 2011 report appears to have been only 192,1 MWac, 40% less. This probably is the result of a re-allocation of the end of year 2009 installation numbers "as having been grid-connected in the year 2009 instead of in the year 2010".
Branche organisation BelPV implied 412,7 MWac for 2009 (smooth green column) in a graph published in February 2011, and a preliminary 165 MWac for 2010. End of 2010 they predicted a small "end-of-year-rush" of possibly 80 MWac in December 2010, that apparently has not materialized in the VREG data published sofar (or it did not happen tot the extent that was anticipated). The strange thing is, that Jo Neyens of BelPV has been one of the 2.943 people, organisations and companies (status: Jan. 20, 2011) signing the petition to the Flemish government ("Laat de zon schijnen" - "Let the sun shine") to prevent harsh degression measures for the coming feed-in tariffs for PV. In that well-written document, dated November 25, 2010 (one of the authors works for the well-known PV-system planner Enfinity), the old market data by VREG (that I originally took as a basic reference) were also used for the calculations (pages 7-8 of the pdf available through that website). There they also took the VREG year report 2009 data, and the following month reports as "true market data" to calculate the probable volume of kWh's produced (and green certificates to be issued) based on that market growth.
If the resulting end of year "accumulation" of installed capacity is calculated from the given (new) data by VREG and BelPV, or derived from the data in the last month reports for 2011 by VREG, the following picture emerges:
In this graph end of year (up till 2010) accumulations have been shown following from the predicted (or, in the case of VREG: newly published) yearly growth rates. The outcomes for the updated VREG registrations and those derived from BelPV's "yearly market growth numbers" now lie close together (there used to be a huge difference). In addition, with the first three month reports by VREG for 2011, and the revisions therein, accumulation of all registered installations already has become 747,294 MWac. If one would take 1,1 as a conservative multiplying factor to calculate the possible DC generator power involved, this could amount to approximately 822 MWp (STC power of all PV-modules).
2010
onwards - overview and details
The
market segment > 10 kWac (status April 5,
2011) could be analysed in detail. For the first time, in the January
31, 2011 issue, the long installation list (pdf of January 1, 2011
report containing 140 pages)
was
published as an Excel file. After reworking that file, it was
much easier to compare that listing with the previous one and extract
from the differences the growth data in the intermittent period.
Regrettably, later reports again were pdf files, so that all pages
had to be screened meticulously to check for changes.
From the first report for 2011 it immediately became clear, that there has been low growth in new registrations for >10 kWac installations in the January 2011 report, for details see graphs showing all month data. In February 2011 the trend has been strongly upwards again, further strengthened in March 2011. In the April 5, 2011 report, VREG-registered PV capacity in this specific category consists of 1.589 installations with an accumulation of 310,3 MWac of inverter power, and an average system (or "entry") size of over 195 kWac.
Small system
size/accumulation
Taking
the accumulation of installations >10 kWac counted by me (and included
in detailed spreadsheets), and subtracting that volume from the separate "accumulation
for all renewable
options"
listing
by VREG, it is possible to calculate the share of the installations
up till 10 kWac ("small market segment"). On April
5, 2011, that segment seems to represent
(calculation here)
an accumulation of 99.346 installations with 436,981
MWac of installed
capacity and an average system size of 4,40 kWac (calculating
with a factor kWac = kWac * 1,1, average STC generator (DC) size for
this important category could be over 4,8 kWac).
Growth numbers
PV-categories big and small
Additions
of new registrations in the last months has been relatively modest
according to the VREG
administration,
in general showing a slacking off the pace shown in 2009. Sofar, the
January 31, 2011 report was a "record breaker" in that negative
trend, with only 8 new additions for installations > 10 kWac, and 2.942
for the "small" category
up till 10 kWac. That negative trend has been reversed in the February,
2011 report, with the important annotation that many new entries are for
previous years, even including installations officially declared installed
in 2009. Reporting from the results from the last months
("installation" meaning:
"entry registered in the VREG records"):
September 2010 (between Sep. 2 and Oct. 1): 91 installations > 10 kWac with 24,07 MWac (average size of 265 kWac/installation) added (note: incl. new additions for previous years). Growth for the market segment up till 10 kWac has been 3.572 new installations with a size of 16,98 MWac (average size app. 4,75 kWac/installation). Total "VREG-registered" additions in 30 days (Sep. 1 up till Sep. 30) has been 41,05 MWac and 3.663 new installations, or 1,37 MWac (122 installations) a day. October 2010 (between Oct. 2 and Oct. 28): 34 installations > 10 kWac with 12,26 MWac (average size of 360 kWac/installation) added. Growth for the market segment up till 10 kWac has been 2.208 new installations with a size of 10,41 MWac (average size app. 4,71 kWac/installation). Total "VREG-registered" additions in 28 days (Oct. 1 up till Oct. 28) has been 22,62 MWac and 2.242 new installations, or 0,81 MWac (80 installations) a day. November 2010 (between Oct. 29 and Dec. 1): 61 installations > 10 kWac with 10,65 MWac (average size of 175 kWac/installation) added. Growth for the market segment up till 10 kWac has been 3.098 new installations with a size of 14,79 MWac (average size app. 4,77 kWac/installation). Total "VREG-registered" additions in 34 days (Oct. 29 up till Dec. 1) has been 25,44 MWac and 3.159 new installations, or 0,75 MWac (93 installations) a day. December 2010 (between Dec. 2, 2010 and Jan. 1, 2011): 47 installations > 10 kWac with 10,53 MWac (average size of 224 kWac/installation) added. Growth for the market segment up till 10 kWac has been 5.181 new installations with a size of 25,28 MWac (average size app. 4,88 kWac/installation). Total "VREG-registered" additions in 31 days (Dec. 2 up till Jan. 1) has been 35,81 MWac and 5.228 new installations, or 1,16 MWac (169 installations) a day. January 2011 (between Jan. 2, 2011 and Jan. 31, 2011): only 8 (!) installations > 10 kWac with 1,42 MWac (average size of 177 kWac/installation) added. Growth for the market segment up till 10 kWac has been 2.942 new installations with a size of 14,47 MWac (average size app. 4,92 kWac/installation). Total "VREG-registered" additions in 30 days has been only 15,89 MWac and 2.950 new installations, or 0,53 MWac (98 installations) a day. February 2011 (between Feb. 1, 2011 and Feb. 28, 2011): 54 new installations > 10 kWac with 9,71 MWac (average size of 180 kWac/installation) added. Growth for the market segment up till 10 kWac has been a healthy 3.594 new installations with a size of 16,78 MWac (average size app. 4,67 kWac/installation). Total "VREG-registered" additions in 28 days has been 26,48 MWac and 3.648 new installations, or 0,95 MWac (130 installations) a day. March 2011 (between Mar. 1, 2011 and Apr. 5, 2011): 104 new installations > 10 kWac with 29,56 MWac (average size of 284 kWac/installation) added. Growth for the market segment up till 10 kWac has been 3.471 new installations with a size of 21,01 MWac (average size app. 6,05 kWac/installation). Total "VREG-registered" additions in 36 days accounted to 50,57 MWac and 3.575 new installations, or 1,40 MWac (99 installations) a day. |
From the above-mentioned data, it has become clear that growth rate in Flanders has slackened in 2010-2011, although growth rates still remain much bigger than in the neighbouring Netherlands (realizing only 11 MWp DC capacity of certified installations in 2010, and an unknown number of uncertified systems).
Market growth
2010
In the April 5,
2011 report adjusted preliminary market growth data for 2010 have been
published by VREG. 192,053
MWac of
new capacity with 31.361 new installations (average new system size:
6,1 kWac). See also the graphs published above. That new, preliminary
"official" volume is 57% below the new capacity
for
2009 according to the last published, official VREG data (growth
for 2009 according to latest VREG data: 442,059 MWac).
It is to be expected that this slackening trend will continue, in particular as rapid downward adjustments of green certificate values for PV has been - finally - agreed upon by the Flanders government for coming years (see interactive graph in this article). Much will depend on the system prices in the market. If these drop considerably, "good growth" still is a possibility for smaller installations. Perspectives for large, industrial size PV-systems, seem to be dire, as reported by branche representatives, in their "appeal" to the government. There is, however, still a large backlog in installations that could become visible in the VREG records in coming months, since an article in Energeia (dated January 21, 2011) showed a considerable number of requests for large installations reported by VREG, with a peak in March (over 120 requests), and another in December (117 requests). Many of those "high-impact" installations still can see the light in coming VREG reports.
Market growth
2011
Since the Feb. 28, 2011 report interesting new data have become available.
One of these is the "adjusted" volume listing per year (since 1985),
with the latest available data for the number of PV-installations
newly
installed
in the year under consideration. And considered eligible for receiving
green certificates by VREG. The original year of installation is
the marker date. Later expansions of installations, a practice common
with a growing number of PV-owners with appetite for more, are considered
separately. If that expansion has an official installation date in
a later year, it is assigned to that year.
For the first two listings (Feb. 28 and Apr. 5, 2011), I constructed this Excel table in which the "backlog" assignment per year can be followed in detail, for number of installations as well as their accumulated new capacity:
(Graph/table
above)
In this screendump of another spreadsheet a comparison is made between
the listings of PV-installations assigned to their (first) year of
installation as approved by VREG in two subsequent month reports (Feb.
28 and Apr. 5, 2011, respectively). In red numbers, changes in the
April report are given with respect to the data provided in the February
report. Sometimes even negative numbers result from that subtraction
(e.g., for PV-capacity changes in 1999 and 2007), possibly referring
to
removed
or destroyed
installations.
However, the most significant changes are positive, and dramatic for the last three years (2008-2010), with changes of 11,2 (2008), 25,4 (2009) and 13,4 MWac (2010) increasing the "new capacities" for those years with fairly big volumes (plus 0,7%, 2,6%, and even 15,2% for 2010). Hence: "actual" market growth data for Flanders and many other regions always should be considered with prudence.
From these two reports follow that in total 50,6 MWac of "accumulated PV-capacity" has been added in the latest, April 5, 2011, report, with 3.575 new installations. But that "only" 13,4 MWac (2.798 installations) has been added to the volume for the present year 2011 with this report, and the rest has been assigned to previous years. Still, many more installations can be added afterwards, to 2011 as well as to the years before. So it is to be expected that the 2011 growth will turn out to become much stronger than shown in the present update: up till the April 5, 2011 report an accumulated new capacity of 20,3 MWac. This "preliminary" volume for the first three months of 2011 is almost twice that of the accumulated certified new installations in the twelve months of 2010 in the Netherlands (with a population 2,6 times smaller in Flanders). With more capacity to be added on the horizon.
Graphs Flanders PV market as compared with Netherlands.
With the January 1, 2011 report, it has turned out that the VREG registrations have resulted in a historical "marker" event: Flanders surpassed the ("official") 100 Wac/inhabitant accumulated installation milestone in that report (with later revisions bringing more capacity for earlier years that marker shifts to a point earlier in time). On April 5 2011, with 747,3 MWac of registered capacity, the 6,3 million inhabitants of Flanders each had 119 Wac virtually installed inverter capacity. Using a factor 1,1, this could result in a virtual, average 130 Wp PV-module on the roof of each inhabitant, such as evident from the interactive figure given below. In this figure also the deplorable situation in the Netherlands becomes evident (green columns), with only something between 4 and 5 Wp/inhabitant at the end of 2010 (just slightly higher if the uncertified new capacity for 2010 becomes known, possibly in the spring of 2011 or later).
It is important to emphasize that Flanders has started only seriously in 2006 with market expansion as the first feed-in legislation was introduced in that year. Netherlands already has considerable experience in PV-installation since the end of the nineties of the previous century, but stifling political desinterest, powerful bureaucrats with their own "visions" of the energy future, and continuous sabotage by parties deeply involved in fossil-based energy generation has prevented succesful implementation of "working" legislation.
The following graph is updated with the data from the April 5, 2011 report. Note that older numbers will have changed, since a backlog of entries still is added on a monthly basis. The numbers give the extrapolated MWp nominal capacity (factor: MWp = MWac * 1,1) based on the published month reports by VREG:
ROLL-OVER IMAGE (above).
Moving the mouse pointer away from the image shows the absolute grid-connected PV
capacity accumulation as provided in monthly reports (note: most
recent data can change afterwards). Given directly in MWp by CertiQ
in Netherlands, but calculated by Polder PV from the AC power registrations
by
VREG for Flanders by multiplying those data with a factor 1,1*.
All installations certified for Flanders, but only a small, app.
10% portion certified for the Netherlands, with status end of 2009
(CBS, all installations) and (columns with dashed outline) for
June 2010-March 2011 only the addition with certified new installations
in 2010-2011 known by CertiQ at the time of publication that the
month report was published.
Moving the mouse pointer over the image gives the calculated capacity accumulation per inhabitant ("per capita"). Both images show strong growth of the Flanders market as compared to the extremely sluggish development in the Netherlands - even under a new "incentive" regime. Calculated accumulated grid-connected capacity for Flanders April 5, 2011: 822 MWp of nominal (STC) capacity (747 MWp accumulated AC power). Ten and a half times as much as was probably accumulated end of March 2011 in the Netherlands (exclusive of yet unknown non-certified installations, see below). As of March 2009 I included the data published by VREG on an irregular, sometimes bimonthly basis.
December 2009 capacity accumulation for the Netherlands is based on the definitive 2009 year report published by CBS in August 2010). Actual accumulation of all installations (certified and, the largest portion, uncertified) is not certain. Grey imports are not accounted for, problems with inventarisation might be expected in a chaotic market, with many system providers not being member of branch organisation Holland Solar and possibly not included in the CBS statistics. Thus, true market growth could deviate in the order of several MWp. According to CertiQ month reports for 2010 data, possibly 2,3 MWp might have been added in the first month of 2010, but there is much confusion about the Dutch data, and CertiQ strangely reported two months of "negative growth" of certified installation capacity (possibly misreported installations, or systems that have been withdrawn from the CertiQ pool for unknown reasons).
According to the end of December 2010 CertiQ report, almost 11 MWp should have been registered as new, certified installations in the Netherlands, as of Jan. 1, 2010 (these should be attributed to the "SDE incentive regime" for installations with approvals in 2008-2010). This, added to the 62,5 MWp accumulation (grid-connected) end of 2009, gives a preliminary status of less than 73,5 MWp end of 2010. With extra additions of almost 3,8 MWp in following January up till March, total "known" market volume adds up to some 77,2 MWp, end of March 2011. The uncertified, not centrally-registered volume added in 2010 is as yet completely unknown (this volume, if registered in a representative manner by CBS, could have been approximately 40% of total capacity sold to end-users in 2009).
Comparison of market development of grid-connected PV-installations in Flanders (blue) versus the Netherlands (light green) is shown in the graph. The new "incentive" regime in the Netherlands (SDE, started on April 1 2008, in essence a combination of net metering [poorly documented in Law since July 2004] and a variable feed-in allowance changing each year) is so bureaucratic and full of various restrictive market caps, that progressive, strong growth has remained an illusion. From renewed calculations of published graphs (new calculations published here) only app. 6,7 MWp had been included as new certified installations in 2009 according to CertiQ data (possibly some lagging installation validations still to be added).
A growing number of system buyers did not even apply for the new SDE subsidies in the Netherlands because of stifling bureaucracy, and many uncertainties. Still, an increasing number of people and companies have acquired uncertified, mostly unreported PV-systems and still do so in increasing numbers. In their year report for 2009, CBS published data resulting in approximately 10,7 MWp of capacity sold to installers in 2009, 10,6 of which would be grid-connected. That indicates that app. 37% of capacity sold did not enter the CertiQ database, do not have a certified meter, and that its green electricity production is probably not registered in any central register. The new conservative, nuclear fission loving minister for economic affairs in the Netherlands, Verhagen, dictated end of November that in 2011 all state-induced incentives for "small-scale" photovoltaics (up till 15 kWac) would be completely abandoned, and that the economic basis for incentives for larger installations would turn out to make that a negative business case in the majority of projects... A plethora of - often short-lived - new "initiatives" has emerged since then. The national PV-market is in total chaos, and an initiative for buying cheap Chinese modules and inverters (app. 13-14 MWp) by a foundation (Urgenda/Wijwillenzon.nl initiative 2010-2011) has met with strong criticism by - mostly experienced - installers, fearing their hard-earned market shares out-competed with heavily subsidized Chinese hardware dumped on the ever-small Dutch market...
In
contrast
Flanders
has introduced an exceptionally attractive package of "Germany-like" (but
not identical) kWh incentive for 20 years (up till 2009 45 eurocent/kWh,
fixed tariff for existing installations, lowered to 35 eurocents/kWh
in 2010, and to a still acceptable level of 33 eurocent/kWh up till
April 1, 2011, with further strong reductions already decided
upon). Added with accompanying net-metering up till zero on a yearly
basis for the smaller installations (max. 10 kW inverter output), and
very interesting tax incentive measures. The Flanders market started
to grow like nuts in 2008-2009, as revealed by updates by VREG, showed
slower growth in 2010, and will probably slacken off to a lower level
as the market value of solar electricity will erode because of the
strong, step-wise degressions of the value of green certificates. In 2011,
"social cost" discussions (hotly contested by branch organisation
BelPV) have eroded political will to further support photovoltaics
forcefully. The social
Minister
Vandenbossche
has openly
"admitted" that PV has grown to fast, and she has pleaded
for more windpower in Flanders.
"Vlaanderen is een 'energetisch ontwikkelingsgebied'". Willy Lievens van educatief centrum Zonne-arc, in een artikel over zijn initiatief in Duurzame Energie van augustus 2001, en aanhanger van de Trias Energetica (besparen boven alles), zal mogelijk zijn mening daarover enigzins hebben bijgesteld anno 2011... |
Flanders: PV has most capacity installed in renewable electricity
© Data VREG, April 5, 2011 report
(Graph
above)
Already
in the end of November 2009 report by VREG, solar electricity had
reached the largest nominal electrical capacity of all considered renewable
options in Flanders,
and increased considerably up till the end of March 2011. Output
in kWh, of course, is much lower in relation to other renewable options
because of the relative low specific production per kWac (PV installations
are unable to produce anything at night). However, this graph shows
how
large the impact on the "renewable electricity market" has
become with respect to photovoltaics in this relatively small, Dutch-speaking
part of Belgium. A sizeable 44,6% of total "nominal" capacity
(1,674 GWe) installed is the most democratic type of electricity generation, "power
to the people" PV.
Renewable electricity generation from wind on land (blue column), which temporarily took over the second place in July 2010 with the installation of 4 new turbines (and 2 new ones in August of that year), has fallen back on an almost equal basis with the burning of biomass originating from agriculture or forestry, and occupied a 3rd position in the April 5, 2011 report according to the VREG data. It is expected that, with the building of an off-shore wind parc (and increased political support for wind on land over solar by Flemish authorities), this situation could change dramatically in the near future. There is, however, also a highly controversial old coal-plant that is refurbished by co-owner Electrabel as a pure "biomass-firing" plant fed with imported Canadian wood chips. This company, having a rather bl(e)a(c)k reputation in Belgium, and de facto a French-backed monopolist (under the umbrella of GDF-Suez), will obtain huge amounts of feed-in incentives extracted from the purses of all Flemish people (end of January also including 4,4 MWp in 15 PV-projects). A move that has loosened the tongues of many people there (Polder PV reported on November 26, 2010, and on December 11, 2010)...
Flanders: distribution among PV-installations > 10 kWac
One of the most interesting sections in the statistics reports by VREG is a detailed overview of the individual installations for the production of renewable electricity (for which green certificates are issued). Up till end of 2010, these data were published as - mostly - monthly pdf documents with a full list of all the installations. This list does not include the small (most PV) installations up till 10 kWac, but gives a fascinating overview of spread in installation size and companies involved, as well as their location (community with zip code). End of January 2011 for the first time this list was presented as an Excel file, facilitating update work. Regrettably, the publication format returned to pdf afterwards, seriously hampering quick analysis of changes between reports published.
Polder PV analysed the last March 2011 report (with 1.589 entries) in detail, extracted the relevant data for PV installations, and summarized the findings in detailed graphs below*. Update >10 kWac listing: April 5, 2011.
* Since data prior to 2011 have been - carefully - extracted from pdf documents, minor errors might have been included in the spreadsheets constructed by Polder PV. They will, however, have little effect on the evident trends published in the graphs published below.
(a) Accumulation of > 10 kWac installation capacity and numbers
2011 - a new year
Accumulation of number of registrations and of total capacity of PV-installations (MWac) up till the last VREG report, April 5, 2011:
 |
© Data:
VREG; Graph: © Peter
J. Segaar/Polder PV, Leiden
(NL) |
Adjusted
numbers exlusive of Loghidden City
In
the April 5, 2011 again two new sections for the Katoen Natie
project have been registered in the VREG data (see special for
details about that project, the 2 new entries are both in the "Desteldonk"-named
part of the sea harbour region north of Gent). Average size for the > 10
kWac category has been 195,3 kWac per installation for all accumulated
entries recorded by VREG.
The following
basic data for the >10 kWac category exclusive of
the single-site Katoen Natie Loghidden City logistics complex in the
western harbour area outside of Antwerp (>27,5 MWac) could be extracted
from the April 5, 2011 update: 1.567 installations (or: separately
registered portions of large installations) with a total of 282,8
MWac
and
an average system size of 180,5 kWac per installation.
Big Players
and large installations registered
On top of Katoen
Natie
sub-projects discussed further below, several other big projects
are included in the VREG lists.
The September 1, 2010, update by VREG first added chunks of the Balta roof project in Wielsbeke by project developer Belfuture, the largest one being 2 MWac (Balta Group published a report on August 19, 2010, claiming a spectacular total of 11,5 MWp [DC capacity] of large PV-projects on 3 of its industrial sites). In a small revision in the October 28 update, three entries were reported as part of this specific project. Together they amounted to one of the largest roof installations (besides Katoen Natie) in Belgium: 4,2 MWp (DC capacity mentioned by Balta). The three entries add up to 4 MWac in the VREG reports. Hence, a DC/AC ratio of 1,05.
Three more > 1 MWac projects were registered in the October 1 report by VREG, one 1,04 MWac installation by Noordkaai NV on the Antwerp (east) side of the Schelde river bank, a 1,105 MWac project in Mechelen by Invictus Mechelen N.V. (the same company that engineered the Katoen Natie project), and a 1,59 MWac installation by SunCop I N.V. in Hingene southwest of Antwerp. Apart from 4 further Katoen Natie fragments > 1 MWac no other such big installations were reported in the October 28 update. The December 1, 2010 update reported another 1,728 MWac chunk of the Katoen Natie project, and a 1,68 MWac installation by Soless on the premises of AGFA in Wilrijk. In the January 1, 2011 report, a 1,012 MWac project bij Stas BV in Sint-Truiden was registered, and three portions of the Katoen Natie project in the Sint-Kruis-Winkel area bordering Desteldonk in the Gent sea terminal region (total of these 3: 4,755 MWac).
No further big (sub)projects appeared in the January 31, 2011 update. However, again two new projects emerged in the February 28, 2011 update. A 1,05 MWac project by Vergalle NV in the village famous for its Spring cycling classic (Ronde van Vlaanderen), Oudenaarde. And a new Seaport Terminals N.V. installation of 1,485 MWac on three warehouses at Mai Zetterlingstraat 70 in Desteldonk. Strangely, that is the same address as a previous entry of the same size under the same company name, with the same zip code, but allocated to Sint-Kruis-Winkel, at the same location just northeast of the Gent harbour region. On that same address 3 other entries of huge installations sized 1,1-2,2 MWac under daughter companies from Katoen Natie (Polymer NV, Sabeen NV) have been included by VREG (however, on other warehouses at this address). It is not yet clear if the "Seaport Terminals N.V." entries actually belong to the famous Katoen Natie project, or that it really is a separate company having done the same thing as their neighbours once they saw how lucrative the solar megabusiness was.
The April 5, 2011 report saw 2 new Katoen Natie entries in the Desteldonk region of Gent (3,11 MWac), and 2 new installations by Invictus, one in Niel (Invictus Boom, 1,084 MWac), and one in Puurs (Invictus Puurs, 2,26 MWac). The latter project probably has been (co-)financed by world's "most sustainable" bank, the Dutch Triodos Bank (having its roots in the antroposophic movement) via their Triodos Renewables Europe Fund in which the webmaster of Polder PV also has a small participation. The annual report 2010 of this fund claims a "Solar plant Puurs" of 2,3 MWp (apparently DC capacity reported) in its portfolio. Puurs lies just south of the river Schelde, and west of Willebroek, where sustainable bank competitor ASN Bank from the Netherlands co-financed a 2,6 MWp PV-project in conjunction with nuclear power plant co-owner Delta from the same country.
There was also an upgrade of a WDP installation in Boom, adding almost 500 kWac to reach a total capacity of 1.911,4 kWac, while at the same time the long-time mysterious 3,6 MWac entry for Serge Hardy Lanaken (for which not one project detail has been published) has been deleted from the VREG records. It apparently never materialized, pressing further questions concerning the validity of a "VREG-registered" status of (large) PV-installations. Of course, all these tiny, but crucial details have an accumulated impact on the reliability of the PV-market statistics "extracted" from the VREG records (the only "reliable" and verbose dataset publicly available for Flanders).
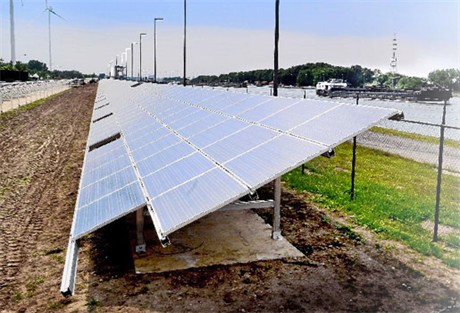
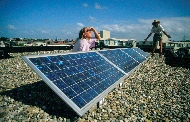
The most surprising additions to the >1 MWac list however, were two entries for a Zonnecentrale Overpelt NV, 6,20 and 6,22 MWac, that will outstrip the "former ground-mounted champion" Heusden-Zolder system of 4,704 MWac (Flemish province of Limburg) that received its first green certificates on December 19, 2008. The precise location of these two "Overpelt" entries (total app. 12,4 MWac) has not yet been published by VREG, but an internet search revelealed it is built on the premises of metal producer Nyrstar (see photo and info). These 2 biggest entries sofar would have been formally accepted by VREG on December 28, 2010, got their first green certificates on Jan. 14, 2011, and are reported to be connected directly to the ELIA (DNB) power grid (not a surprise given the fact that Nyrstar is a metal producer using huge amounts of electricity). Overpelt is situated in the Flemish province of Limburg alongside the Zuid Willemsvaart canal in a region bordering the southern province Noord Brabant in Netherlands.
The huge Katoen Natie project remains, of course, by far the biggest - roof mounted - installation in the Benelux, see the special further below.
Special: More big players in the Flemish market A number of big players act with large, mostly roof-top PV-installations on the Flemish PV-market. With a lot of money to spend (real estate owners Katoen Natie, WDP), highly professional personnel keen on intelligent roof projects and concepts (e.g., Enfinity), long experience in the installation sector (e.g., SolarAccess, mostly working for big project developers under whose name the project is listed in the VREG records), or good contacts with financial parties, they have realized many large PV-systems in a relatively short period of time. Most of these projects will see very interesting "internal rates of return". Although with politically decided strong degression of feed-in tariffs, in particular for these large projects, the number crackers with these companies will have to redo their homework to be able to realize economically viable superprojects in the near future. Falling module prices and BOS ("balance of system") costs will certainly help to that end, but political support for solar appears to be dwindling due to one-sided "social cost" discussions. At the end of January 2011 I made a selection of some of the most notable big players on the Flemish market, exclusive of Katoen Natie which is considered here as a "very special and unique case" (see special). The source data are published by VREG on a monthly basis in their >10 kWac project listing. In the table, first the main company name (sometimes appearing under a slightly different name), in the second column the number of big PV-projects realised by that company (selection), and in the final column the total capacity involved in these projects (in kWac accumulation). This table adds up to 93 MWp, which represented approximately 14% of total VREG-registered market volume in Flanders, end of January 2011. Mostly projects of hundreds of kWac or even over 1 MWac are included here. The listing is not exhaustive and known newer projects are not yet included.
The table lists a variety of companies, ranging from an energy utility deeply involved in huge amounts of fossil and nuclear power (Electrabel, actually Belgium's super monopolist under major French stake-holder Suez), PV-specialist companies like Enfinity (famous for its fast rise, and active in many countries including China), Belfuture, and Zonnecentrale. But also big retailers like Colruyt and Ikea are highly active, and, as an example of further potential, at a very benign level realizing smaller projects on schools etc., several Flemish communities ("Gemeentes div."). Another "special case" is the bank consortium ING (originating in the Netherlands) that had realised a considerable volume of approximately 5 MWac in 21 projects at that time, mostly via their Equipment Lease branche. GFS Veurne is one of the few "big" free-field installations in Flanders (southwestern part of Belgium, close to the French border). It has been realised by Netherlands (Venlo) based Scheuten Solar together with Flemish project developer Green Fever, and the installation has a size of 2,7 MWp (DC capacity, represented by 2,58 MWac in the VREG records, in two different segments). The "Zonnecentrale" company is also very interesting. Only 6 installations have a total capacity of 10,3 MWac, a spectacular system average of 1.710 kWac per installation. The biggest one is Heusden-Zolder 4,704 MWac (only recently replaced as "the biggest" by a 12,4 MWac project in Overpelt); the other projects can be found in Beringen, Genk, Hasselt, Lommel and Maasmechelen (system sizes between 429 and 2.670 kWac). One of the most striking players shown in this table is, however, a big real property company (in Flemish: "vastgoedbevak"), the stock-exchange-quoted Warehouses De Pauw (WDP). It is represented with almost 11 MWac of large projects in the January 2011 VREG listing, and the company is planning a volume of approximately 30 MW of renewable capacity on or nearby its own warehouses and other property to be able to exploit their business on a "CO2-neutral" basis at the end of "Kyoto" year 2012. In a press release dated April 28, 2010, the company announced it already had 10 MW of PV projects realised in 2007-2009, and that it was planning another 8 MW in a new phase that should end in the first half year of 2011. Already 10 percent of the company's income (5 million Euro/year) is said to originate from the feed-in tariffs earned by these big PV-projects in a news item of August 25, 2010 (and others). Many people in Flanders think that is not the way things should go in Belgium. Because all electricity consumers pay a rate on top of their kWh tariff from which the green certificates are financed by the net managers. Including those for huge projects such as parties like WDP have realised or will build in the near future... |
(b) New installation capacity per month or in the VREG reporting period
An example of a the new capacity per category is given below for the busy month May 2010, in which many new big installations were registered by VREG:
|
© Data:
VREG; Graph: © Peter
J. Segaar/Polder PV, Leiden
(NL) |
This graph shows the newly known capacity that VREG included in their reports, distributed among 7 categories selected by Polder PV. Note that this also included new capacities included for previous years. Due to irregularities in the appearance of the VREG reports, sometimes data of two months are lumped (e.g., March-April), or an incomplete month has been given by VREG (e.g., June, apparently June 29-30 not included). Monthly distributions may vary considerably. In the May 2010 report over 42 MWac of new PV-installation registrations with sizes over 10 kWac were reported by VREG. In February of the same year it was less than 7 MWac. The January 2011 report showed an exceptionally meagre harvest of only 1,4 MWac in this category. Since the periods do not always cover exactly one month, they cannot be simply compared with each other. Therefore, the daily averages for the VREG reporting periods should be calculated, generating a more sound basis for comparison between months. This is presented to you in the next interactive graph, updated up till the end of 2010 (c).
(c) Average new installation capacity per day in the VREG reporting period
This interactive graph shows values calculated from the spreadsheet used for the previous one shown under (b). It reveals big differences in new capacity added to the VREG registrations per month in the period February-December 2010. Since not exactly whole months are covered, the results haven been calculated on a per day basis for each period.
|
© Data:
VREG; Graphs: © Peter
J. Segaar/Polder PV, Leiden
(NL) |
ROLL-OVER IMAGE: Move mouse pointer over the buttonbar below the figure to show the relevant image (status reports by VREG for Flanders in 2010). This graph shows the average of the new installations per day in the given periods only, distributed among 7 categories. Monthly distributions may vary considerably. In 2010, after a sluggish period in March-April, following the end of the "January-February allowance" period for installations not yet having an inverter at the end of December 2009 (decrease of green certificate value from 45 to 35 Eurocents/kWh), May was a busy month again. This is probably the result of delayed registrations by VREG through the time-consuming administrative processes. In the period June 29 till the end of July, in particular the extreme growth of the largest >1 MWac category has been apparent. This is largely to be attributed to the first 9 fragments (total: 15,37 MWac) of the huge Katoen Natie 40 MW project on 4 locations in Flanders finally appearing in the VREG records. Holiday month August showed considerably less activity in the data reported by VREG, and newly registered installation capacities dwindled afterwards. Notably, the collapse of the previous "strong" category of >100-500 kWac installations has been apparent as of October 2010. In November 2010, the >500 up till 1.000 kWac category did not even have one single new registration. The 2 bigger categories were mainly fed by separately registered sub-installations of the huge Katoen Natie project since the summer months, with the addition of only few other big projects not related to the "super" category of Katoen Natie. Further below please find two more graphs visualizing daily average progress for separate categories, extracted by Polder PV from the VREG data.
In the final graph of this section the per day graph for the last month reviewed by VREG is shown, revealing the data for Feb. 28 up till April 5, 2011 (36 days):
 |
© Data:
VREG; Graph: © Peter
J. Segaar/Polder PV, Leiden
(NL) |
For interactive graphs under (c) legend: grid connected systems > 10 kWac only; light green = number of new registrations (left Y-axis); light orange = new added capacity (MWac or kWac) in the period under consideration, per category. Graph (b) shows the total capacity and/or number of registrations in the given example. Graph (c) gives the capacity and/or number of installations per day and per period (interactive) as extracted and calculated from the data reported by VREG.
For the reported multisite project Katoen Natie 40 MW on 4 locations in Flanders, parts of which for the first time were incorporated into the VREG statistics in the July 2010 update, new portions were added in the later updates, starting with August 2010. This huge project (cost: € 166 million), partly financed by loans from Dexia Bank and another, unnamed bank, is cut into a lot of smaller pieces between 0,21 and, possibly, 2,22 MWac under various (new) company names. Most probably for financial reasons (optimal taxation issues related to the green certificates earned?). Up till the October update, only one installation was mentioned under the identifiable name "Katoen Natie Terminals NV", a second segment under that name followed in the November update, but all the other projects have been filed under different sub-company names (and in a later stadium designated as such by VREG in their installation records).
Two new entries appeared in the Jan. 1, 2011 update, under the location Sint-Kruis-Winkel (together 3,27 MWac), for Katoen Natie daughters Polymer NV and Sabeen NV. These are at the same installation location address for which already a "Desteldonk" entry was known, accumulating to 4,95 MWac for these 3 subprojects in the sea harbour region of northern Gent. In addition, a fourth entry was filed under the name Seaport Terminals NV (1,485 MWac) on that date, with Sint-Kruis-Winkel as location, and a fifth entry under the same name and with identical size in the Feb. 28, 2011 report, again with Desteldonk as location (all: same zip-code and same address...). The latter two are on exactly the same address, on different logistics halls (numbers 17-19 and 19-21; the three Katoen Natie entries here have been realized on halls 14-16, 26-30 and 36-39), but it could not yet be established if Seaport Terminals N.V. is a daughter company of Katoen Natie or not (VREG does not give a positive clue in this direction). As for now, the Seaport Terminals entries are not considered as part of the "Katoen Natie" super project.
Also note that one of the smaller (246,3 kWac) "Kallo (Kieldrecht)" segments has been earmarked with an address that is on the eastern side of the Vrasene Dock, more to the southwest of the Loghidden City complex (Land van Waaslaan Haven 1168/Saeftinghe Loods 5). So actually this is a separate location. Still no "hits" appear to have been included for the so-called Euroterminal of Katoen Natie to the southwest of that separate Vrasene Dock, that has been said to be part of the whole 40 MW project.
The April 5, 2011 VREG report lists 22 portions (27,51 MWac) for the Kallo-Kieldrecht location on the Schelde West-Bank (not on Antwerp soil, but nearby on the premises of the province of East-Flanders). In addition to this, now at least 5 portions for the Katoen Natie logistics terminal in the Desteldonk/Sint-Kruis-Winkel area are known in the harbour region northeast of Gent (also on soil of East Flanders; 8,12 MWac). Finally, 2 installations in the Katoen Natie terminal area of Genk in the Flemish province of Limburg in the northeastern part of Belgium are also reported with a total size of 2,15 MWac under the prozaic (and confusing) company name "Ghendt Handling And Distribution NV" (which has its main office in Desteldonk/Gent...). Taken all together a total capacity of 37,8 MWac for the multisite Katoen Natie project has now been registered with VREG and positively identified as such to that project. Note that this volume still is only 94,5% of the total of 40 MW announced as early as end of 2009. But it is also possible, that the frequently mentioned "40 MW" may be the DC power of the whole project, which could easily match 37,8 MW of max. AC power of the inverter systems involved.
From the data so far extracted from the VREG records, it is crystal clear that the Kallo-Kieldrecht location, named "Loghidden City" by Katoen Natie has, with its 22 portions now registered by VREG, 27,51 MWac. Since the VREG report for July 2010 it already is officially the largest realized "single site" PV (but multi-roof) project in the Benelux, with decreasing possibility that more volume will be added in coming VREG reports. As of now, the actual status of the other portions of this enormous roof PV-project remains enigmatic as well. Euroterminal, also in the West-Bank area of Antwerp's huge harbour region extending into East-Flanders, has not been specifically mentioned yet by VREG.
Not
belonging to "Katoen Natie"? Sofar, no distinct connection of this company (G.W.S.) has been found in relation to the Katoen Natie holding, despite the fact that several K.N. entries have a somewhat reminiscent daughter company name ("Ghendt Handling And Distribution NV", 2 of them in Genk, and one single site just southwest of Katoen Natie's "Loghidden City" on the Schelde West-Bank). Activities of both companies clearly are focussed on large-scale warehousing services - in exactly the same harbour areas. Together these 4 Desteldonk Ghendt Warehousing sub-projects accumulate to an installation size of 1,352 MWac. |
Katoen Natie line-up
One of the interesting new data since publication of the Jan. 31, 2011 Excel spreadsheet on the VREG website is the fact that per installation the official installation date is show, as well as the date on which the first green certificates have been awarded to the project (actually the final step in the whole "official procedure" for PV with the VREG administration). With these data it could be shown that for the now 29 positively identied installations for the Katoen Natie super project a time span of less than 4 months lapsed between the official installation dates for the first (Sep. 4, 2009), and the last sections identified (8 sections on Dec. 31, 2009). But that over 14 months have lapsed between the dates on which the first green certificates issued for the first (Sep. 3, 2009) and final two sections (November 16, 2010) incorporated in the April 5, 2011 VREG update. I summarised the findings in the following 2 new graphs.
 |
^^^ See next graph for the dates on which first green certificates were issued for the separate sub-installations of Katoen Natie by VREG. |
 |
^^^ Indicated in numbers are either the capacities of single sub-projects per issue date, or the accumulation of the capacities if different sub-projects were issued on the same date (per location). If more than one sub-project is shown in one column, the number of sub-projects for that column is shown in brackets. The total of sub-projects positively identified as belonging to Katoen Natie amounted to 29, 22 of them for Loghidden City (actually one small sub-project lying very close, for now included in the Loghidden City data). Total capacities identified for the three main locations are indicated in the legend. The red line indicates the start of the new incentive scheme beyond the "transition period" allowed by the Flemish authorities. If installations had the modules in place end of December 2009 (with report of preliminary approval), and were able to have the PV-system completed with inverters end of February 2010, they would be eligible for 45 Eurocents/kWh feed-in tariff for 20 years. If that dead-line had not been realized in time, the installation will only fetch 35 Eurocents/kWh for 20 years (if installed completely in 2010). Also all other installations not having the modules in place end of 2009, and newly realized in 2010, will get that much lower (but still highly interesting) premium. As per January 2011 new degressions have been decided, starting with 33 Eurocent/kWh on that date (no transition period). These considerations do not apply to the Katoen Natie project, since all sub-installations apparently have passed the "transition period" without problems, and can apply for 45 Eurocent/kWh for 20 years. Note that the time-scale in this graph is different from that used in the previous graph for the "Date of official installation". |
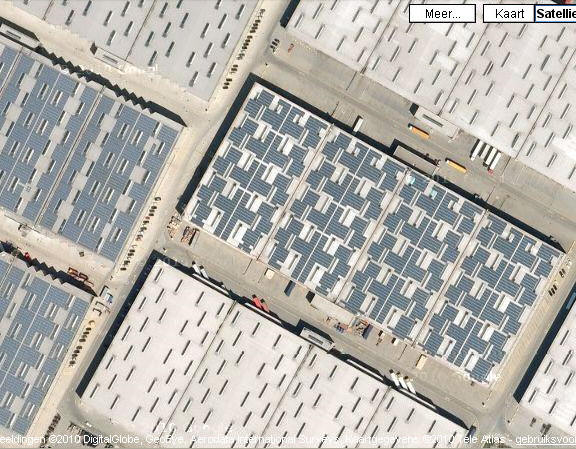
Five installations under the same "Katoen Natie umbrella" have been registered as such in the Desteldonk/Sint-Kruis-Winkel/Gent region (Mai Zetterlingstraat 70, see photo of the complex on the Katoen Natie website), as well as two on the Katoen Natie logistics terminal in the industrial area south of Genk in the Flemish province of Limburg. On the latter complex, 2,15 MWac has been registered in 2 segments for the company Ghendt Handling and Distribution N.V. This website shows that this company also is part of the large Katoen Natie holding. Overall, still a few MW of the multi-site superproject might not yet been validated (or approved, or fully registered) by VREG. The 40 MW project was "claimed" as such at the end of 2009 by the principles of Katoen Natie in a few short press communications and television broadcasts. It still is not clear if the "40 MW" claimed refers to AC capacity, or possibly to the MWp nominal capacity of the PV-modules involved (source: Trina Solar, China). See also the photograph below.
Photo © 2010
DigitalGlobe, Geo Eye, Aerodata International Surveys / Google
Maps project (this
location).
Photo 1 - The first Katoen Natie terminal buildings filled with Trina Solar modules were appearing in Google Maps satellite photo's midway 2010, such as this one. Three halls had been completed already at the time that this photo was taken. It shows the southwestern part of the huge "Loghidden City" complex in the Kallo/Kieldrecht harbour region northwest of Antwerp on East-Flanders province soil (Schelde West Bank). Other halls appeared to have already mounting frames in some areas, but most halls did not show any roof-related activity yet. However, a company video by installer Invictus shows that at least this "Loghidden City" complex is mostly filled with crystalline PV-modules - although a small volume of the reported multi-site 40 MW project still might not be documented in the VREG statistics (status: April 5, 2011 update).
Note the lorries on the photo to get an impression of the enormous scale of this logistics complex. It is also evident from the satellite pictures that the halls, and also the modules themselves are oriented in arrays slightly south from SW. This has only slight impact on physical production, not deviating much from a pure south orientation. The project as a whole (at least three different locations) should produce in the order of 35 GWh/year according to press releases. This could indicate an expected specific production of only 875 kWh/kWac.year. This might be a conservative estimate.
The first partial projects of this site ("Kallo/Kieldrecht" location) have been reported by VREG in the August 1, 2010 report (8 segments on this location and one in Gent/Desteldonk, total of these: 15,37 MWac); more sections followed in later VREG reports.
Flanders:
distribution among PV-installations < 10 kWac
Installaties kleiner of gelijk dan 10 kWac in Vlaanderen: verdeling
Once the number and capacity of the accumulated > 10 kWac installations is known from the separate list for that category (previous paragraph), it is easy to obtain the data for the smaller PV-systems in Flanders since VREG also publishes a list ("Productie-installaties waarvoor groenestroomcertificaten worden toegekend") with accumulations of the capacities and numbers for all renewable electricity generating installations. By subtracting the volumes for the > 10 kWac category PV-systems from the accumulation given in that list for all (PV-)installations, the data for the remaining < 10 kWac installations can be calculated. This results in the two following graphs. First total volumes and their distribution are shown for photovoltaics.
Relative
contributions of market segments in photovoltaics Flanders
In this graph
in the left "100 percent column" the share of the categories
discriminated by me
(all
installations
up till
10
kWac,
and 7 subcategories
larger than 10 kWac) is shown for the numbers of installations (for
the largest systems sometimes separate entries of fragments, such as
Katoen Natie's Loghidden City: one complex, 22 entries). From that
column it is crystal clear that the <10 kWac segment of the
market
is the unparallelled contributor, with 98,4% of all PV-installations
(or segments) installed.
A very different outcome shows up when the installed capacity is taken as the discriminating value, as depicted in the right "100 percent column" with stacked categories ("MWac"). Here, the <10 kWac segment only claims 58,5% of accumulated installed (AC) capacity, and over 40% is claimed by installations each having a capacity larger than 10 kWac. Of those, the biggest "total capacity contributor" is the >100 up till 500 kWac segment with 15,3% of accumulated photovoltaic AC capacity. The "top" market segment, installations (or system segments) larger than 1 MWac each, claim 12,8% of total accumulation, and the >500 up till 1.000 kWac segment contributes 7,0%. The contribution of the market segments >10 up till 100 kWac is much smaller to negligible.
Note that VREG does not further discriminate any subcategories in the "small" market segment up till 10 kWac. Hence, no further "split" can be made in the white column parts in this graph.
Relative
contributions of PV-systems in the >10 kWac category
In
the largest market segment >10 kWac, I also distinguish between subcategories,
and the contribution of those in the installated volume for only that market
segement (hence: not for all PV-installations) has been visualized in the
next graph.
The same scheme is applied here as in the previous graph. For "100 percent" now the accumulated volume for only the >10 kWac market segment is used (number of installations and inverter capacity, respectively).
In the left column, shares of the 7 subcategories discriminated by me have been shown with respect to the number of installations (or installation segments separately registered by VREG), revealing dominance of the >100 up till 500 kWac subcategory (30,5%). Shares are relatively well spread among subcategories, however with minor contributions of the >10-15 kWac, and the 2 largest subcategories.
In the right column, again accumulated capacity (MWac) for each subcategory is the discriminating feature in relation to accumulated installed capacity for the >10 kWac market segment. Here, again the same >100-500 kWac subcategory leads the way (share of 36,9%), followed by the two other important top subcategories, larger than 1 MWac (30,8%), and >500-1.000 kWac (16,8%). These top 3 subcategories together make up 84,5% of total installed/registered capacity in the >10 kWac market segment. For comparison, please note that installations >100 kWp were not allowed under the highly restrictive SDE "incentive" regime in the bordering Netherlands up till 2010.
Average of new installations per day
The listings for all new PV-installations (accumulation of numbers and nominal capacity only), and the one for the individual >10 kWac PV-systems are published separately by VREG. The publication date of these updates can differ slightly. To be able to compare the progress in new installations on a daily basis for the category larger than 10 kWac as well as that for the smaller PV-systems (max. 10 kWac), separate calculations have been carried out by Polder PV for the average daily newly reported capacity, as well as for that of the >10 kWac systems. Average daily progress in new VREG registrations has been calculated by dividing the growth in the monthly report under consideration by the exact number of days spanned by that report. Furthermore, to obtain the daily average for the <10 kWac pool, the calculated values were subtracted (total average minus average for >10 kWac group). With the results, I could obtain the following graphs, showing the considerable fluctuation in daily average level of registration on a monthly basis for both groups considered.
^^^
Stacked
graph
Results
for both groups stacked to show average daily progress in the periods
designated on the X-axis. Note that these need not represent exact
monthly periods. For example, there were no separate reports for March
and April 2010, so the average daily growth for both months together
has been calculated. Not all months were fully covered in one report. Therefore,
the result
for that month has been calculated from the span within that month
as indicated by the dates of publication indicated by VREG. Examples
are June (1-29) and October (1-28) 2010. Note
that the daily average for new registrations in the category >10 kWac
installations (green column
segments in this graph) fluctuates considerably through the months
of the year, in between 247 and 1.651 kWac on average per day up till
2010 (difference maximum factor 7). Which can be attributed only partly
by the inclusion of very
large installations > 1 MWac in a certain period. An "all-time-low" is
apparent in the VREG registrations for January 2011, only 47 kWac added
per day in that month for the "big" category. It
is expected that long validation and registration times might also
play
an important
role in the uneven distribution of these large installations in the
VREG registration statistics. For example, the 40 MW Katoen Natie
project, already reported as "installed" end of 2009, still
might not have been fully
registered
as
of
April 5,
2011, in these statistics (still a few MW missing).
Another example: The 1,87 MWp amorphous silicon thin-film project on the Flanders Expo, already reported by me begin of December 2009, only has reached the VREG listing in the April 5, 2011 report (in 5 separate entries with 1,596 MWac, hence DC/AC ratio of 1,17), thus showing the long time between project realisation and VREG registration.
The smaller market segment of <10 kWac (blue column segments in this graph) shows a more stable development, ranging between 316 in the Spring months March/April up to a notable end-of-year mini-rush of 816 kWac in December, average per day (factor 2,6 difference). For all installations together, July was a real record breaker, new installations being recorded by VREG with an average of 2.133 kWac a day. Note that, while January 2011 has been a dramatic month for development of the market registration for installations > 10 kWac, the registrations for smaller PV-systems appeared to be unaffected, with a healthy 482 kWac/day of new installations. February and March 2011 continued that healthy trend with almost 600 kWac a day.
Graph
aligned + trends
In the
next graph the results for both market segments are shown alongside
each other:
For both categories also (Excel-generated) linear trend lines have been incorporated in the graph. For the period shown (February 2010 up till March 2011), there is a conspicuous downgoing trend for the daily average new capacity registered for installations > 10 kWac by VREG (green dashed trend line). Instead, a clear upward trend is apparent for the PV-systems with a maximum size of 10 kWac in the VREG registrations (blue dashed trend line). One should be cautious to interpret these as "real market trends". Predictions as to how the two market segments will evolve are hard to make, and will be highly effected by the degression steps in the feed-in categories decided upon by the Flemish authorities (see interactive graph with the degressions to be implemented in coming years, analyzed by Polder PV on December 11, 2010). Another critical factor will be the "perception" with the Flemish inhabitants, as publications related to solar development, costs, and benefits, appear more frequently in the newspapers, magazines, radio, TV and, of course, on the internet. Finally, the delay in registration in the VREG records, sometimes long after installations have been connected to the grid is a factor making interpretations of market development in Flanders a difficult task.
Detailed
graph for segment > 10 kWac
For
the market segment of >10 kWac installations, for which individual
system size details are available in a long list on the VREG website,
a more
detailed daily average graph could be made:
Detailed split of the 7 capacity categories discerned by Polder PV to show development in average daily new registrations in the periods shown on the X-axis (month reports by VREG). In particular the larger categories >100 kWac fluctuate considerably in the course of time. If this is "true installation reality", or that it might be a flaw of the administrative delays in the registration system with VREG, or perhaps both, remains unclear. The peak in the period June 29 up till August 1 ("July") for the largest category >1 MWac (green curve) could be attributed to the first 9 sub-installations of the Katoen Natie superproject being registered by VREG, resulting in a "month-average" of 792 kWac newly installed capacity for that category per day.
Note that in the Dec. 1, 2010 report, an installation of 12 kWac in the small market segment of installations up till 15 kWac has been removed in the VREG update, which resulted in a slight "negative growth" for the last month in this graph (not discernable at this detail level). In the April 5, 2011 report 7 smaller installations in the >10 kWac category (10-15 kWac), and the 3,6 MWac Serge Hardy project have been removed for unknown reasons. Sometimes upgrades (capacity) and renewals of previously registered installations occur in several VREG month reports, but in general they have only minor influence on general "growth" trends such as depicted in the graphs in this section.
The graph shows very clearly the considerable negative impact on the registered market growth in all segments > 10 kWac at the start of the new year (2011). Growth in registrations had almost come to a stand-still in January 2011. Luckily, February and March 2011 showed a positive development again.
Calculation
of the impact of the market segment of maximum 10 kWac
When subtracting the capacity of 310,31 MWac for the > 10 kWac
installations (graphs above) from the reported total of 747,29 MWac in
the separate installation
listing in the VREG April 5, 2011 update, a volume of 436,98 MWac remains
for the "maximum 10 kWac" installations market segment.
With installations removed from the most recent VREG list taken into account, the number of installations > 10 kWac turned out to have grown to 1.589 in the April 5, 2011 report (average size for that category: 195,3 kWac/installation). VREG reported in the same month a total accumulation of 100.935 registered PV-installations (report also date-stamped April 5, 2011). Hence, 99.346 systems (or, preferrably: "registrations") should be allocated to the category of max. 10 kWac installations.
Taking these two data together, 99.346 smaller (mostly but not exclusively: private households) "installations" with a total capacity of 436,98 MWac (58,5% of the Flemish market with respect to capacity installed) would have an average system size of 4,40 kWac. If the basic data for this calculation are considered correct.
Additions to the >10 kWac list - status April 5, 2011
As of the beginning of 2009 I planned to screen the intriguing listing of >10 kWac Flemish installations (revised pdf with 119 pages for the April 5, 2011 update). In the graphs above I have visualized the changes for this category. In this section I will emphasize some of the most important changes and additions to that list.
Photo © JUMA Beton NV- IZ Maatheide, Maatheide 105, 3920 LOMMEL, Belgium (photo from this web page)
Photo 2 - Lots of inverters (72, to be precisely), for a large 770 kWp PV-installation with multicrystalline Scheuten Solar modules in Lommel. Added to the VREG inventory in the February 2010 listing, although only 730 kWac was specified there, a generator [DC]/[AC] inverter ratio of 105%. 3.942 [195 Wp] multicrystalline modules on the 17.500 m² industrial roof of Juma Beton NV (Valeres building group, see also their news item, and the Global Solar Technology article, July 23, 2009). The installation, delivered in October 2009, has been realized by the Dutch system house Scheuten Solar (see project page), in conjunction with the engineering bureau 3E. For more photo's see this link on the Juma Beton site.
New (and sometimes removed) installations (April 5, 2011) since previous (February 28, 2011) VREG report in classes defined by Polder PV (installations added to the VREG list in 36 days time, many of them formally installed in 2010 or even in 2009). Details published by VREG for > 10 kWac installations only:
Previous
large additions in the > 1 MWac category (selection): "missing" capacities... In contrast to the Veurne solar parc, no other entries can be found in the VREG data for the "missing" part of the Willebroek installation on the Brico halls under the work name Willebroek NPG, nor under the entry of its address, the Hoeikensstraat in Willebroek-Noord. The WDP system of 1.592,5 MWac on the Victor Dumontlaan ("Klein Willebroek"), approximately 600 meters in the northeast, and on the other side of the Kanaal van Willebroek, reported in a previous VREG overview (published June 1, 2010), clearly is not part of this specific Delta/ASN project. |
Special: Distribution of PV-installations among net managers involved
Another interesting new issue published in the first Excel spreadsheet by VREG (Jan. 2011) has been the net manager region in which the solar electricity is being produced for the installation category >10 kWac. This feature was not published earlier. From the data I extracted the following graph to give a general view of distribution among net managers in Flanders (status Jan. 31, 2011):
Situation as of January 31, 2011. Note that the X-axis is in logarithmic scale, to be able to incorporate the accumulation for all VREG registrations at the bottom-line (in deviating colours). Yellow bars are total number of installations, with the actual number in black at the left (scale: bottom X-axis). In orange bars accumulated capacity in the net manager region is added, with the actual data at the right end of the bars, in kWac (scale: upper X-axis). The net managers with most > 10 kWac installations at that time were Gaselwest (327), Inter-Energa (285), and Imewo (191), respectively. With respect to total installed capacity, the order is Inter-Energa (51,7 MWac), Gaselwest (51,2 MWac) and Intergem (45,8 MWac).
Still another picture emerges if the average installation capacity is calculated per net manager. In that case, the high-voltage net manager Elia (DNB) branch wins the race with 696 kWac per installation (only 5 of them). This is the result of the large 2.670 kWac Zonnecentrale in Lommel included in their (small) portfolio. Second is net manager Sibelgas with 378 kWac on average per installation (only 11 PV systems >10 kWac, 7 of them much larger than 300 kWac, the biggest one being a 1 MWac PV-plant by Sunergy in Grimbergen). Finally, Intergem, with a respectable number of 126 installations, has an average capacity of 363 kWac/system. The reason: the Loghidden City terminal of Katoen Natie is in their region, and that installation alone has already 27,52 MWac evenly distributed among 22 sub-installations (1,25 MWac on average per section).
"Small" players in this respect are net managers AGEM, Intermosane and IVEG with only few installations >10 kWac, and an average system size of 48-66 kWac. GHA is the "Gemeentelijk Havenbedrijf Antwerpen", the organisation responsible for the net connections in the harbour region on Antwerp soil (hence: east of the river Schelde). It has only 6 installations >10 kWac, with an average of 161 kWac per system. It is, again, good to realize that Katoen Natie's Loghidden City Terminal is not on Antwerp soil, but instead on that of the province of East-Flanders (West-Bank of river Schelde). Although it is often "mentally connected" to Antwerp because of the important harbour region in which it is situated. There are interesting but unverified "stories" being told why the major harbour city of Antwerp does not have the biggest installation of the Benelux on its premises...
Flanders - renewable electricity mix shows clear PV component
From the last pdf document "Number of green certificates issued" of VREG the most actual pie diagram has been calculated, from data provided in the period 2002 up till April 2011 (in earlier reports, VREG gave its own pie-diagram for green certificates issued). Note that also this diagram is lagging behind with respect to the actual situation since not all green certificates have been issued yet and a large back-log has yet to be filled in.
April 5, 2011 update
 |
^^^ This graph can and will change as new data for green certificates issued by VREG become available in more recent reports. Data for certificates issued in 2011 have not yet been included in the present graph. Status: © April 5, 2011 VREG Flanders |
The next diagram (new make-up by VREG since Feb. 2011) clearly shows the rapidly increasing and high impact of solar electricity in the "green" electricity mix of Flanders. In particular during the summer period (yellow segments):
 |
^^^ Vertical scale is in MWh (1 green certificate standing for 1 MWh), max. value on scale is 350 GWh of green certificates issued in a month time. Note! Colours in this graph do not necessarily match with the ones used in the pie-charts by VREG! Status: © April 5, 2011 VREG Flanders |
In the next graph, introduced for the first time by VREG in the Feb. 28, 2011 status report, the number of green certificates issued by VREG for (only) photovoltaics is given (for graphs for other "renewable" electricity generating options, please refer to the original VREG publication):
 |
In the summer of 2010 (highest peak at far right) already almost 75.000 green certificates for photovoltaics were issued by VREG, good for a volume of approximately 75 GWh. Status: © April 5, 2011 VREG Flanders |
Finally, the last graph in this section shows the green certificates that have already been validated as guarantees of origin (GO's) for solar electricity in Flanders up till 2010, and the ones that have yet to be validated:
This graph shows that over 482 GWh of solar electricity produced on Flemish soil has already been issued in the form of Guarantees of Origin (GO's) end of 2010 (yellow column segments). And that still over 104 GWh of green certificates were in the waiting line to be validated as "green electricity actually sold as such" (green column segments stacked on top). The total of 587 GWh could in theory be used to "greenwash" the yearly electricity consumption of app. 167.700 households (each using 3.500 kWh/year), or almost 8.400 households during a period of 20 years.
For 2010 only, the share of solar electricity in the green mix has already risen to 15,9%, while in 2009 this was only 5,2%*. Due to serious backlog of certificates to be turned into GO's, this percentage could change in the course of time and become even higher. The share in total electricity consumption has already broken the 1% barrier. These numbers are already more positive than in those published by some Belgium websites (e.g., this one).
* Please note that in the first graph of this section (pie chart) the accumulated share since green certificates were issued in the year 2002 is given, hence the much lower value there. Photovoltaics started growing only seriously as the new incentive regime started in 2006. Prior to that year only few PV-installations were providing certificates.
Special: first date of green certificates awarded for projects >10 kWac
A new interesting data found in the first Excel spreadsheet on the VREG site (January 31, 2011), is the first date that Green Certificates (GSC's) have been awarded for the bigger (>10 kWac) projects listed by VREG. This information has not been available in the monthly pdf documents issued by the organisation up till the end of 2010. I made some new graphs based on this interesting new "feature" in the VREG records (note: data used from Jan. 31, 2011 report).
CLICK on image for magnification
This first graph (above) shows the number of installations per month that the first GSC's were issued for the projects listed. Interestingly, already in October 2003 the first installation >10 kWac was awarded as such, a 15,12 kWac installation in Heusden-Zolder. This installation is, however, removed from the VREG list of April 5, 2011 (reason: unknown). The community that in a later stage, December 2008, welcomed the biggest free-field installation registered by VREG, the 4.704 kWac project by PVZG_Zonnecentrale Limburg NV (in the April 5, 2011 report 2 segments of a bigger solar parc were however introduced). Also clear from this graph is the huge peak in December 2009, in which 388 installations >10 kWac were awarded their first GSC's by VREG. The level dropped however dramatically at the end of 2010.
CLICK on
image for magnification
In this second graph the same is shown as in the previous one, but now the total capacity added for each month that new installations were awarded with their first GSC's is given (in kWac of nominal capacity). Here there are more big peaks, mostly resulting from a few big projects awarded their first GSC's in one month, such as the enormous Katoen Natie project for which on several occasions a number of sub-projects were issued on the same day or in a short time by VREG (see Katoen Natie special, with separate graph). The peak for December 2009 is highest, with 39,9 MWac of >10 kWac projects in one single month, followed by April 2010, with 34,0 MWac, including 10 of the big Katoen Natie sub-projects (totalling 14,7 MWac) in that short period. The second half of 2010 showed a dramatic decline of new capacities awarded per month.
In this final graph the "VREG-awards" for first GSC's for PV-projects >10 kWac has been given on a daily basis for the busiest month in Flemish history, December 2009 (again: Jan. 2011 report used for data). The number of projects awarded as such is indicated in yellow columns (with black numbers on the bottom line). The total capacity of all projects on the same day is given in orange-coloured columns with the capacity calculated in brown numbers on top of the columns (in kWac). The busiest days were December 23, 21, and 29, 2009, with 33, 32, and 31 projects awarded, respectively. However, if one looks to capacity added on one day, December 18 got the trophy, with first GSC's awarded for 4,3 MWac on a single day. Note that weekend and holidays (Christmas) are under represented: no or hardly any GSC's were issued on these non-working days.
More
details on Flanders PV market
Wetenswaardigheden
over de Vlaamse PV markt
Foto © AGF.nl, referentie: http://fotoalbum.agf.nl/PAViewAlbum.asp?ID=683&CMD=THUMB&page=2
Photo 3 - Small part of the installation on the renovated Mechelse veiling (according to VREG May 2010 report: 1,014 MWac) in Sint-Katelijne-Waver. According to an ensemble in the photo-album of AGF.nl 5.500 PV-modules would have been installed here, and 8.900 MWh a year of solar electricity would be produced. That is, however unlikely, because that would suggest 8.777 kWh/kWac a year production. Most likely, a yearly yield of 890 MWh (specific yield: 878 kWh/kWac.year) is applicable here, more in line with production mentioned in the AGF article (message of 22st of March 2010). A financial pay-back time of 6,5 years has been suggested for this installation, which could turn out to be true, because of the extremely interesting combination of predictable, hence calculable, financial incentives in Flanders in the period that this installation was connected to the grid. According to the V&R The Solarcompany website, that company from Heusden-Zolder would have realised this interesting PV project (see pdf).
Dutch summary of most important extra findings from the VREG data for the Flemish PV market
Extrapolating
possible 2009 new PV-capacity for Flanders on basis of VREG
reports (renewed calculation)/Hernieuwde extrapolatie nieuw
PV-vermogen in Vlaanderen Later is het VREG jaarrapport over 2009 verschenen (mei 2010). VREG repte daarin van een fors hogere bijbouw in 2009 van 245,051 MWac, bestaande uit 47.273 nieuwe PV-installaties (gemiddelde systeemgrootte: 5,18 kWac). Mogelijk omdat ze systemen in de "overgangsregeling" tot en met eind februari 2010 deels hadden meegeteld, maar ook een grote hoeveelheid nog niet. Nog weer later kwam VREG opeens met significant aangepaste nieuwe cijfers voor 2009, in het februari 2011 maandrapport (zie analyse). Eindejaars-accumulatie voor 2009 werd toen opeens aanzienlijk opgeschroefd naar 523,159 MWac, en de jaargroei in dat jaar tot een forse 430,818 MWac (75,8% meer dan in het vorige jaarverslag gerapporteerd...). De meest actuele (doch nog steeds niet definitieve) stand van zaken in het rapport van 5 april 2011 voor 2009 is alweer 534,498 MWac, de - voorlopig - officiële jaargroei voor 2009 heeft een respectabel volume bereikt van 442,059 MWac. Omdat VREG de officiële cijfers leverende instantie is, houdt Polder PV zich aan deze "voorlopig-definitieve" jaarcijfers voor 2009 voor de Vlaamse PV-markt, totdat er nieuwe zijn verschenen. Daarbij nogmaals de waarschuwing dat zelfs nadat een jaarrapport is verschenen, VREG nog steeds jaarcijfers van eerdere jaren achteraf kan bijstellen, hetgeen zelfs op maandelijkse basis geschiedt. Met de grootste wijzigingen te verwachten voor de meest recente jaren in het betreffende jaaroverzicht. |
© Invictus
NV, Wilrijk, Flanders, Belgium.
Photo
4 - Video still of the highly interesting, 3 minutes
long company
video of Invictus NV from Wilrijk (near Antwerp) in which
nice shots can be found of the preparations for, and installation
work
pertaining to this massive roof-oriented PV-project, the biggest
in the Benelux countries sofar. Two of the huge logistics halls
of Katoen Natie - here on the video still - have been painstakingly
filled with Trina Solar modules (big Chinese module quality producer)
wherever they seemed to fit.
* Ter vergelijking: in het gereviseerde 2009 jaar rapport van CertiQ voor de "Nederlandse gecertificeerde productie van hernieuwbare elektriciteit" werd gewag gemaakt van slechts 6.567 aangemaakte certificaten (zonnestroom) voor dat jaar (zelfde "waarde"). In het maart 2011 rapport van CertiQ werd een accumulatie (!!!) van 49.675 certificaten (elk 1 MWh, totaal dus 50 GWh) sinds 1 juli 2001 gerapporteerd. Waarmee duidelijk wordt dat de "gecertificeerde" productie van zonnestroom in Nederland (lees: de kWh productie waar het allemaal om draait en die "ten faveure van de kabinets-doelstellingen zou mogen worden toegerekend"...) nog steeds niets voorstelt. Vlaanderen zit daar met nog een backlog aan definitief toe te kennen certificaten (totaal te vergeven/reeds vergeven plm. 812 GWh) al een factor 16,2 overheen. Met daarbij wel de kanttekening dat het overgrote merendeel van de (paar tienduizend) PV-systeempjes in Nederland nooit in de CertiQ gegevens is bijgeschreven en ook nauwelijks wordt bemeten (en zeker niet "gecertificeerd"). Wat duidelijk maakt dat die database dus ook nog eens een zeer slecht referentiekader is om de totale productie van zonnestroom in Nederland aan "af te meten".
© HBVL.be (this
webpage).
"Free-field" PV-plant, probably the Diepenbeek (?) lock along the
Albert Canal between Hasselt and Genk, province of Limburg, Flanders,
Belgium.
Photo 5 - An interesting new phenomenon in the application of photovoltaic
generation of electricity: solar power plants along channels to produce green
electricity
for heavy-power locks in those waterways. In the VREG reports, two such PV-plants
have been included. A 429 kWac installation near the lock of Mondeolaan in the
industrial area of Genk-South. And a 462,5 kWac installation near "Het Sas",
the lock along the Boksbeemdenstraat in NE Hasselt (both in Limburg province
in the
eastern part of Flemish territory).
These
were
registered
under
the newly erected company Zonnecentrale De Scheepsvaart NV in the December
1, 2010 project listing. A
good
initiative,
but
a third project in between these two VREG-registered projects, near Diepenbeek
lock,
has been seriously questioned earlier this year by a spokesman of the Groen!
(green)
party
since there were a lot of problems with permits and questionable connections
between
interested
parties (see this
document with critical questions by spokesman Peeters to Minister
of public affairs of the Flemish Parliament, Crevits, and this
news item on the HBVL webiste). Also windpower (see photo), and sometimes
even
hydropower
are used for the high electricity needs for such locks.
© IZEN, photo from project page of the PV-system developer
Photo 6 - Aerial view of the two large blocks of the Zonnecentrale Overpelt NV on the premises of the metal producer Nyrstar (old deposit fields for zinc tailings, 13 hectares covered) in the heavy industry complex "Overpelt werkplaatsen" near Overpelt, alongside the Zuid Willemsvaart canal visible in this photo, running left to right. Location: Flemish province of Limburg not far from the border with Netherlands. System developer IZEN, famous for its beautiful large-scale PV-installations in Belgium, built this project, and the first multicrystalline 54-cell module was symbolically installed on the first of October 2010 by project partners Group Machiels*, Nyrstar, LRM*, Gemeente Overpelt and IZEN (see also press release by Nyrstar and video on TV Limburg). The project has been realized completely in 2010. In the background the greyish-blue surfaces are small artificial lakes, north of the Zuid Willemsvaart in the "Kolonie" region bordering the province of Noord Brabant in Netherlands.
There is some confusion with respect to the ultimate size of this free field, ground-mounted project, in early 2011 the largest of its kind in the Benelux (pushing long-time 4,7 MWac Heusden-Zolder in the same province to the second position). IZEN claims having built an installation of 7,6 MW, with 36.192 modules (hence, an average-size 210 Wp/module, a normal type for such a modern installation). Thus, most probably 7,6 MWp (STC DC-power) is suggested. However, the 2 new >6 MWac project entries "Zonnecentrale Overpelt NV" in the VREG database (included in the April 5, 2011 month report) add-up to an inverter power of 12,42 MWac. This is far beyond the nominal STC power given by IZEN, leading to a speculation that (much) more DC power must have been included in this project than so-far claimed by IZEN (or other project partners). Possibly, a new extension has already been included in the preliminary VREG update?
The 7,6 MW[p] installation reported by IZEN/Nyrstar would generate an amount of electricity "equivalent to that used by 2.000 households". If the frequently quoted 3.500 kWh/household.year would be used, that would indicate a production of 7 GWh/year. Taking the 7,6 MW system size mentioned by IZEN, this would lead to a specific yield of 921 kWh/kWp.year, which seems to be a more realistic value for such an optimized large, south-oriented free-field installation than the often quoted (but rarely documented) 850 kWh/kWp.year specific yield claim in Belgium.
Investment has been "over 20 million Euro" according to IZEN, which means that at least 2,63 Euro/Wp would have been paid for the whole system. Even if it would turn out to be somewhere in the range of € 3,00, it would be a "fair" price for Flanders, where sometimes developers complain to the government that planned degressions of the value of the green certificates earned by PV-installations are going to fast for large, utility-size systems such as the present one. That could claim 35 Eurocent/kWh produced for 20 years since the project was realized in 2010...
* Group Machiels and LRM are the most important shareholders of "Zonnecentrale Limburg", planning more of these large-scale PV projects on parcels of waste land not usable for other purposes. Nyrstar consumes all the electricity produced on-site.
http://www.izen.be/professioneel/nieuws_2/pv/izen-bouwt-grootste-zonnecentrale-van-de-benelux/
Conclusion
PV-capacity in Flanders Region/Conclusie Vlaanderen
Based on the newly revised, but still not "definitive" data
(VREG year reports (2009), and last revision, Apr. 5, 2011) and
the preliminary results for 2010, we can conclude with the following
estimates.
Met de
herziene
gegevens zoals hierboven weergegeven (o.a. gebaseerd op de jaarrapporten
van VREG, de laatste van 2009, en revisie gepubliceerd 5 april
2011), en de voorlopige resultaten voor 2010, kom ik op een voorlopige
schatting voor PV in Vlaanderen:
Accumulation 2010 (VREG)/Accumulatie 2010 (VREG) 726,9
MWac (800 MWp*)
Growth in 2010 (VREG)/Groei in 2010 (VREG) 192,1 MWac
(211 MWp)
36% growth
with respect to 534,9 MWac end of 2009
36% groei t.o.v.
534,9 MWac eind 2009
Accumulation
2009 (VREG)/Accumulatie 2009 (VREG) 534,9
MWac (588 MWp)
Growth in 2009 (VREG)/Groei in 2009 (VREG) 442,1
MWac (486 MWp)
476% growth
with respect to 92,8 MWac end of 2008
476% groei t.o.v.
92,8 MWac eind 2008
Accumulation
2008 (VREG)/Accumulatie (VREG) 2008 92,8
MWac (102 MWp)
Growth in 2008 (VREG)/Groei in 2008 (VREG) 67,1
MWac (74 MWp)
205% growth
with respect to 22,0 MWac end of 2007
205% groei t.o.v. 22,0
MWac eind 2007
* Conservative conversion factor maximum inverter AC power > MWp generator power (DC): 1,1
Decrease of yearly growth 2010 with respect to that in 2009/Afname van de jaarlijkse groei van 2010 t.o.v. die in 2009: factor 0,1
Increase of yearly growth 2009 with respect to that in 2008/Toename van de jaarlijkse groei van 2009 t.o.v. die in 2008: factor 2,3
Number of inhabitants
Flanders Region (exclusive of Brussels, which has 1.123.085 inhabitants,
this
link): 6.251.983
Aantal inwoners Vlaams Gewest (= exclusief Brussel, wat 1.123.085 inwoners
telt,
deze
link): 6.251.983 (Wikipedia;
ref. year 2010)
PV-capacity per
inhabitant Flanders Region estimated for end of 2010: 128
Wp/capita**
PV-capaciteit per inwoner van Vlaams Gewest geschat
voor eind van 2010: 128 Wp/hoofd**
** (Factor AC > DC: 1,1). End of 2009 this was approximately 94 Wp/capita (taking most recent VREG data, Apr. 5, 2011). Based on the April 5, 2011 VREG report, it had increased to 131 Wp/capita; see interactive graph.
The
rest of Belgium: Walloon region and Brussels (updated
end of 2009)
De rest van België: Wallonië en Brussel (ververst tot en met eind 2009)
Wallonië/Region Wallonne ("Waalse Gewest")
De ontwikkeling van "hernieuwbare" elektriciteit ("électricité verte") wordt in het Franstalige deel van België, Wallonië (incl. de Duitstalige enclave) bijgehouden door de Commission Wallonne pour l'Énergie, CWApE. Daarbij moet meteen worden gesteld dat ook fossiel gestookte warmtekrachtkoppeling onder "groene" elektriciteit wordt gerekend, wat op zijn minst als hoogst discutabel mag worden beschouwd. In ieder geval worden er ook middels aparte berekeningen "groencertificaten" voor uitgegeven, "certificats de garantie d'origine". De Waalse zonnestroom/"duurzame" energie markt wordt in twee delen opgesplitst, de installaties tot en met 10 kilowatt die op eenvoudige wijze de aan hen toegekende groene certificaten kunnen verzilveren, en de categorie groter dan 10 kW. De overgrote meerderheid van de zonnestroom systemen in Wallonië valt onder de "kleine" categorie, eind 2008 stonden er nog maar 7 installaties > 10 kWac met een totaal vermogen van 167 kWac als "gecertificeerd" bij CWApE bekend.
De website van CWaPE is helaas niet bepaald overzichtelijk, het kost veel tijd om documenten te vinden waar marktontwikkelingen voor PV - met moeite - uit geëxtraheerd kunnen worden. Het zou handig zijn als er een duidelijk tabblad "statistieken" zou worden opgenomen op de website, net als bij de Vlaamse collega's.
 |
^^^ (Note: Y-axis with logarithmic scale!) Aantal gecertificeerde installaties die groene certificaten ontvangen en bij CWaPE eind 2008 stonden geregistreerd. Gestapeld: installaties kleiner of gelijk aan 10 kWac (lichtgroen), resp. groter dan 10 kWac (donkergroen). Links de PV-installaties, in totaal 2.678 geregistreerd. Data: CWaPE 2008 rapport (pdf) |
2008
Een
definitief rapport over 2008 werd op 13 oktober 2009 gepubliceerd.
De belangrijkste data, status eind 2008:
 |
^^^ (Note: Y-axis [kW] with logarithmic scale!) Totaal geaccumuleerde gecertificeerde capaciteit van installaties die groene certificaten ontvangen en bij CWaPE eind 2008 stonden geregistreerd. Gestapeld: installaties kleiner of gelijk aan 10 kWac (lichtgroen), resp. groter dan 10 kWac (donkergroen). Links de PV-installaties, in totaal 8,928 MWp geregistreerd. Data: CWaPE 2008 rapport (pdf) |
2009
Over
het jaar 2009 zijn nog geen harde gegevens bekend. Echter, een specifieke
publicatie
van de CWaPE geeft een handvat voor een "verantwoorde
schatting". Dat is de publicatie met grafieken van de op het net
aangesloten decentrale productie eenheden per netgebied met een aansluit
capacteit
van maximaal 10 kVA, gepubliceerd op 17 november 2009: "Situation
des Unités de Production Décentralisée
(UPD)
de max 10
kVA". Hierin staan per netgebied mooie taart- en staafdiagrammen,
waarbij vooral de explosieve groei van de productie eenheden kleiner
dan 5 kVA (9.778 eenheden) resp. tussen 5 en 10 kVA (1.409 installaties)
opvallen. Dit kunnen haast niet anders dan (bijna) uitsluitend zonnestroom
installaties zijn. In totaal is er in Wallonië volgens dat document half
november 2009 maar liefst al 40.108,4 kVA aangesloten, waarbij dat
een jaar eerder, november 2008, nog maar 7.654,4 kVA was. Dat is een
explosieve groei (bijna 32.500 kVA aan installaties in een jaar tijd)
tot maar liefst een factor 4,24 maal het in november 2008 aan het net
gekoppelde
"vermogen < 10 kVA".
Indien het een PV-systeem betreft slaat kVA waarschijnlijk
op
het opgestelde omvormer uitgangs-vermogen, en niet op de (in de meeste
gevallen hogere Wp) STC capaciteit van het daar achter aangesloten PV-systeem,
het effect is
natuurlijk
vergelijkbaar
en indicatief.
Detail from screendump of CWaPE document [pdf] showing enormous growth in capacity of "installations for decentralized production" of maximum 10 kVA (kilovoltampère) in the Walloon region, since November 2008 (3 data points). Please refer to the last set of three columns - the rest of the graph showed the distribution among the different net manager regions. "Régie de Wavre" is just visible on the left in this graph, the right ensemble shows the relevant total for all net regions ( "Total général"). The columns most probably represent (or: include) all the < 10 kVA PV-installations connected to the grid in this one-year period. Growth is staggering: from app. 7,7 kVA in November 2008 (blue, "nov-08"), via 25,3 kVA in August 2009 (red, "août-09"), up till 40,1 kVA in November 2009 (green, "nov-09"). Difference between the November data is 32,4 kVA of installed capacity. This will not be exclusively PV, but it certainly represents the booming private PV-market segment for the biggest part. |
 |
Als we nu uitgaan van een conservatieve schatting van slechts 80 procent van het aandeel groei in zonnestroom capaciteit t.o.v. die van totale "decentrale productie vermogen kleiner of gelijk aan 10 kVA", en we dus zouden rekenen met een factor 0,8 x 4,24 = 3,39 maal het in (november) 2008 opgestelde vermogen voor die "kleine" categorie (8,8 MWp fotovoltaïsch), komen we voor november 2009 grofweg uit op een totaal geaccumuleerde 30 MWp op basis van het november 2008 cijfer. Hierbij zitten dan ook nog de "grote" installaties die buiten de hierboven getoonde grafiek vallen (> 10 kVA). Op de CWaPE website gedateerd 20 oktober 2009 vinden we een lijstje voor die "grote" categorie voor slechts 5 installaties met een totale grootte van 120,6 kWac (zie pdf). Merkwaardig omdat het er eind 2008 nog 7 waren met een totale capaciteit van 167 kWac. Daarnaast vinden we een vergelijkbaar gedateerd document (pdf) met een "wachtlijst" van PV-systemen met in totaal 10 installaties met een gezamenlijke capaciteit van 707,84 kWac. Het is vooralsnog niet duidelijk of die laatstgenoemde wachtlijst nog in 2009 officieel is "toegelaten" tot de CWaPE certificatie. Maar als we op die lijstjes zouden moeten afgaan zou het ook niet zoveel uitmaken, ze bevatten samen immers minder dan 1 MWp aan "grote" systemen.
Hiaten
Toch
moeten we niet vergeten dat ook de Walloonse bureaucratie mogelijk
weer eens flink achter de werkelijkheid
aan registreert. Als we namelijk de Franstalige ef4.be
database bekijken (NB:
al lang aan het net gekoppelde PV-installaties in zowel Wallonië als
de hoofdstad Brussel), missen we in de hoogste categorie groter of
gelijk aan 50 kWac (waar trouwens
ook een paar fout opgegeven kleine particuliere systemen staan) in
ieder
geval
het prachtige, reeds in de september 2009 uitgave van Photon uitgelichte
"Galaxia" 300 kWac façade
project in Libin-Transinne (provincie Luxembourg).
Trouwens, ook de daar gerapporteerde, uit 250 stuks SolarFabrik modules
bestaande 55
kWac installatie
van Belgacom
Towers in Saint-Josse-ten-Noode (direct ten noorden aan het Brusselse
stadscentrum grenzende wijk) vinden we (uiteraard) niet in het overzicht
van CWaPE terug. Maar ook niet in het overzicht wat toezichthouder
Brugel
voor
de
Brusselse
hoofdstad
heeft
gepubliceerd
(zie verderop).
Daarbij komt dan ook nog dat in het "traject 10 tot 50 kWac" in diezelfde ef4.be database maar liefst 22 installaties staan vermeld (van 10,5 tot en met 44 kWac per stuk), die beslist niet allemaal in de 2 (> 10 kWac) lijsten van CWaPE staan vermeld (totaal slechts 15 stuks groter dan 10 kWac in de publicaties van 20 oktober 2009). 4 van die ef4.be installaties staan in Brussel (en zouden dus door Brugel moeten worden/zijn opgenomen), maar 18 stuks zijn elders in Wallonië te vinden. De door mij geschatte 30 MWp accumulatie aan PV-installaties voor 2009 in Wallonië (zelfs met uitsluiting van het grote Brusselse systeem), dient dan ook waarschijnlijk als "minimum" te worden gezien...
Terugschroeven "luxe
regeling" en nieuwe bedreiging
Op het Photovoltaikforum stond op 16 oktober 2009 een blijkbaar goed
geïnformeerd
(Duitstalig) bericht dat de zogenaamde extra premie van maximaal 3.500 Euro (of
20% van de kosten van een PV-systeem) per februari 2010 in Wallonië komt
te vervallen. Dit i.v.m. de gebruikelijke "gaten in de overheidsbegroting" en
nog resterende lucratieve andere incentives (groencertificaten en een - gecapte
- 40% belastingaftrek regeling). Op de Bruxelles-renouvelables website werd in
de web publicatie "Hernieuws" van januari 2010 aandacht aan nog meer
onheil besteed: een mogelijk aankomend "injectietarief" voor decentrale
opwekkers, die de terugverdientijd voor met name aangekochte PV-systemen drastisch
ten negatieve zou gaan beïnvloeden. Voor berichten zie:
http://tinyurl.com/yfh5jzj (verkorte
link naar het artikel op Photovoltaikforum)
http://www.bruxelles-renouvelable.be/sites/default/files/hen20_Web_press.pdf (pdf
1,52 MB; o.a. Nederlandstalige beschouwing van de dreigende "ingreep" in
de rentabiliteit van PV-installaties in Wallonië)
Conclusion
PV-capacity in Walloon Region/Conclusie Wallonië
Met de twee sets gegevens zoals hierboven weergegeven kom ik op een
voorlopige schatting voor PV in Wallonië:
Accumulation
2009 minimum/Accumulatie 2009 minimaal 30
MWp*
Growth in 2009 minimum/Groei in 2009 minimaal 21
MWp
235% growth with
respect to 8,928 MWp end of 2008
235% groei t.o.v. 8,928 MWp eind 2008
Number of inhabitants
Walloon Region: 3.456.775
Aantal inwoners Brussel: 3.456.775 (Wikipedia)
PV-capacity per
inhabitant of the Walloon Region expected in 2009: 8,7
Wp/capita
PV-capaciteit per inwoner van Wallonië verwacht
in 2009: 8,7
Wp/hoofd
* Photon auteur Christoph Podewils had het in juni 2009 over 9 MWp nieuwbouw in 2008 en "mogelijk 20 MWp nieuw in 2009" voor Wallonië. Wat dus waarschijnlijk ook al voor Franstalig België (excl. Brussel) een veel te lage inschatting is geweest op basis van het nu beschikbare materiaal. In genoemd artikel ook een totale schatting voor heel België van 110 MWp nieuw, waarbij de Europese PV-organisatie EPIA nog "ietwat optimistisch" van 175 MWp bijbouw in 2009 zou uitgaan. De realiteit heeft iedereen weer eens ingehaald, want het is allemaal veel te laag geschat. Het is veel meer geworden, mogelijk zelfs 240 MWp nieuw erbij in een jaar tijd, zie verder.
Brussel/Bruxelles (estimate end of 2009)
Voor Brussel moeten we weer bij een andere "autoriteit" zijn (België is en blijft (ook) een land vol bureaucraten en babylonische spraakverwarring). En wel bij de "Reguleringscommissie voor energie in het Brussels hoofdstedelijk gewest", Brugel. Daar is redelijk snel een overzicht te vinden tot en met 2008, in een publicatie van 30 oktober 2009 (link onderaan).
 |
^^^ © Brugel, 2009 (pdf) |
In tabellen en Nederlandstalige tekst is uit het rapport ook redelijk snel de essentie te halen:
2009
In
een artikel op
de informatieve website van Bruxelles-renouvelable.be wordt een eerste
beschouwing van de "tendensen in 2009" gegeven. Geschat wordt
dat er eind 2009 zo'n 3 MWp aan PV-capaciteit kan zijn geaccumuleerd. Zie
de grafiek:
 |
<<< BHG = "Brussels Hoofdstedelijk Gewest" © Bruxelles-renouvelable.be (this link). |
Conclusion PV-capacity in Brussels/Conclusie Brussel
Met de twee sets gegevens zoals hierboven weergegeven kom ik op een voorlopige schatting voor PV in Brussel:
Accumulation
2009/Accumulatie 2009 3
MWp
Growth in 2009 approximately/Groei in 2009 ongeveer 2,3
MWp
329% growth
expected with respect to 0,677 MWp end of 2008
329% groei
verwacht t.o.v. 0,677 MWp eind 2008
Number of inhabitants
Brussels: 1.103.502
Aantal inwoners Brussel: 1.103.502 (Wikipedia)
PV-capacity per
inhabitant of Brussels expected in 2009: 2,7
Wp/capita
PV-capaciteit per inwoner van Brussel verwacht
in 2009: 2,7
Wp/hoofd
Estimation
for PV-capacity (growth in) Belgium
Schatting PV-capaciteit geheel België
Note: data must be completely revised as soon as reliable data for Walloon region and Brussels become available. Shown here is an older calculation!
Based upon the (preliminary and revised) data for Flanders (VREG), Walloon Region (CWaPE), and Brussels (BRUGEL) in the previous sections, we can make a rough estimation for the whole of Belgium:
2008 accumulation: 102 + 8,9 + 0,7 = 111,6 MWp
(shares 91, 8, and 1%, respectively, for Flanders, Walloon Region, and Brussels)
EurObserv'ER estimated in their overview of development of the PV-market in Europe (10th State of Renewables report, publ. March 2011, download from this page) for Belgium as a whole 70,870 MWp accumulated grid-connected capacity for 2008. An apparent under-estimation of almost 41 MWp (app. 36% lower than Polder PV's estimate).
2009 accumulation: 576 + 30 + 3 = 609 MWp (rounded)**
(shares 95, 5, and <0,5%, respectively, for Flanders, Walloon Region, and Brussels)
Growth 2008 >>> 2009 for Belgium as a whole: approximately 497 MWp (rounded). By which the "small" country Belgium possibly more than doubled the growth volume of its sunny neighbour France (Eur'ObservER: 211 MWp new grid-connected in 2009)...
Number of inhabitants Belgium (Wikipedia numbers accumulated): 10.721.877. However, here PBR data 2010* is used, 10,8 million:
PV-capacity per inhabitant of Belgium expected in 2009 : 56,4 Wp/capita
* 2010 World Population Data Sheet [pdf]of the Population Reference Bureau of the United Nations: 10,8 million halfway 2010.
** The renewable energy promoting organisation Edora published an extensive study with renewable energy market predictions for 2020 in February 2010. In that report, a graph has been published in which Edora claims that the Belgium photovoltaic market could have accumulated to 304 MWp in 2009. See article published on February 13, 2010.
*** In Photon International of February 2010, in an article by Garrett Hering en William P. Hirshman (including reference to earlier preliminary data and prognoses by Polder PV), the following preliminary estimates were given by Jo Neyens of BelPV (233 MWp added in 2009 in Belgium), as well as by Photon Consulting that made a prognosis of 275 MWp growth for 2009 (and a forecast of 500 MWp for 2010...).
Eerdere stukken op Polder PV over het PV-mirakel Vlaanderen...
Volledige
update mei 2010 Vlaamse PV markt (15
juni 2010): Vlaanderen passeert met gezwinde spoed de 400
MWp drempel en Polder PV past de statistiek pagina aan.
Vlaanderen
op naar 350 MWp PV accumulatie (5
mei 2010, achtergronden van het zoveelste PV-record bij
de zuiderburen)
Kerstman strooit
rijkelijk met cadeau's bij de Vlamingen: PV naar ... 236 MWp (24 december 2009)
ASN en zonnestroom
II: 2,6 MWp project Willebroek (12 december 2009)
Tale-telling
VREG grafiek - Vlaanderen neemt definitief afscheid van Nederland (10 december 2009)
Sjoemelen
mag - voor de ghoede saeck II. Met 40 MWp PV-moois (9 december 2009, Katoen Natie pakt grootschalig uit met PV)
Sjoemelen
mag - voor de ghoede saeck I (9 december
2009, "overgangsmaatregel" 45 >> 35 eurocent/kWh)
Meest
geplaatste module types België cf. Sonnenertrag (11 november 2009)
Je kunt
ook overdrijven... (10 november 2009, Vlaamse ondernemers willen ook
het Duitse EEG...)
Vlaanderen:
geen "injectietarief" PV-bezitters,
ook voor andere DE-opties overwogen (3 november 2009)
Andere
buurman pruttelt verder: Vlaanderen plaatst september 18 MWp bij
(7
oktober 2009)
Vlaanderen
verplettert Nederland met zonnestroom: > 122 MegaWattpiek
geïnstalleerd. (18 augustus 2009)
Progressie
PV Nederland en Vlaanderen (6 juli 2009)
Waar een wil is is
een weg (7 juni 2009, met ook enkele data voor Wallonië)
Zonnestroom
in Vlaanderen groeit lekker verder: 90,8 MWp (7 mei 2009)
Keerzijde
van het (Vlaamse) PV succes (29 april 2009)
"Het" is
geschied: Vlaanderen is Nederland voorbij gescheurd (9 april
2009)
Tale telling passage (22
maart 2009)
CBS velt "het oordeel" over
PV-Nederland, Vlaanderen rukt razendsnel op (3 december 2008)
Belgische
PV-markt groeit snoeihard (29 augustus 2008)
Lieven Lefebvre:
dikke "hollandsche" PV-installatie (17 juni
2008)
Oh la la... (18 maart 2008)
Such is
the incredible power of a feed-in tariff... (11 oktober 2007)
Vlaanderen
op weg naar record PV-jaar (26 februari 2007)
Inspiratie opdoen bij de zuiderburen (19
oktober 2005, begin van de "revolutie")
... en een snuifje Wallonië
Solaire Ardennoise (13 oktober 2008)
Segaar, P.J. (2011). Belgian Solar Market Cooling Down Following End of 2009 Boom. - SolarPlaza (March 1, 2011). Electronic publication (summary of present web page, update of Walloon and Brussels region)
Hirshman, W.P. & Podewils, C. (2011). Flandern will Vergütung kürzen. - Photon 1/2011: p. 13.
Hirshman, W.P. (2010). Gedämpfte Erwartungen. Belgien legte 2009 bei der Photovoltaikleistung gewaltig zu - nun ist ein Dämpfer programmiert. - Photon 9/2010: pp. 17-18.
Segaar, P.J. (2010). Flanders leading the way in Belgium with photovoltaics. - SolarPlaza (April 1, 2010). Electronic publication (summary of present web page)
Podewils, C. (2009). Boom-boom Belgien. Warum die Solarmärkte in Flandern und in der Wallonie um 100 Prozent jährlich wachsen. - Photon 6/2009: pp. 24-26.
Köpke, R. (2007). "A lot will happen here". The Belgian solar market is considered promising - especially when looking at the potential of the PV industry. - Photon International 3/2007: pp. 20-53 (landen special).
Relevante organisaties: ODE België, Vlaams Energie Agentschap, VREG. Voor Wallonië: "Portail de l'énergie en Région wallonne", certificatie instantie CWAPE. Voor Brussel: Brugel, resp. Apere, "hernieuwbare energie in Brussel".
Overzicht
van alle organisaties die met (hernieuwbare) energie van doen hebben
in België:
http://www.brugel.be/Public/Menu.php?ID=12&siteID=2&language=dut
EurObserv'ER
rapport 2008 met (verwachte) marktdata voor (o.a.) België in de
jaren 2007-2008 downloaden van:
http://www.eurobserv-er.org/downloads.asp
PV
in Vlaanderen:
http://www.photon.de/news_archiv/details.aspx?cat=News_Archiv&sub=Politik&pub=1&parent=2755 (17
september 2010, fors afwijkende getallen voor de bijbouw in België
cq. Vlaanderen, waarschijnlijk door de eind tot eind februari 2010
pas "officieel" aan het net gegane PV-systemen nog bij
2009 te rekenen; Duitstalig artikel)
http://www.ode.be/index.php?page=elec-uit-zon-markt (marktontwikkeling
Vlaanderen tot en met 2007)
http://www.vreg.be/nl/06_sector/04_groenestroomproducenten/08_statistieken/04_groenestroom.asp (meest
actuele, uitgebreide detail data van de VREG, loopt echter soms 1-2 maanden
achter wegens overwerkte administraties)
http://www.vreg.be/nl/06_sector/04_groenestroomproducenten/08_statistieken/01_rapporten.asp (rapporten
pagina van VREG met o.a. de jaarcijfers in de vorm van "Marktrapport 20##")
http://www2.vlaanderen.be/economie/energiesparen/milieuvriendelijke/TA0509PV.pdf (pdf
met artikel "Zonnepanelen scoren hoog", tevreden zonnestroom klanten
in België/Vlaanderen. Test Aankoop publicatie met enquête
onder 3.300 PV-systeem eigenaren)
PV
in Wallonië
(incl. Duitse "enclave"):
http://energie.wallonie.be/fr/le-solaire-photovoltaique.html?IDC=6185 (zonnestroom
in Wallonië)
http://www.cwape.be/xml/doc.xml?IDD=5701&IDC=107 (recentste
aansluit gegevens voor "decentrale productie eenheden" (waaronder de
allergrootste bulk van PV-installaties) in Wallonië, status
17 november 2009)
http://www.cwape.be/xml/themes.xml?IDC=1532 (overzicht
van diverse rapportages over groene elektriciteit in Wallonië,
inclusief zonnestroom)
http://www.waalsweekblad.be/zonnepanelen.shtm (Goede
Nederlandstalige info over de financiële ondersteuning van
zonnestroom in het Waalse Gewest)
PV in Brussel:
http://www.brugel.be/Files/media/ElecVerte/Lijst_installaties_2008.pdf?siteID=2 (lijst
met grotere installaties gecertificeerd voor ontvangst groencertificaten,
met 5 PV-systemen)
http://www.brugel.be/Files/media/Rapport-Certificats-Verts-2008-v-1.1-NL.pdf (verslag
markt groenestroom certificaten Brussel tot en met 2008)
http://www.bruxelles-renouvelable.be/sites/default/files/hen20_Web_press.pdf (samenvatting marktgroei PV in Brussel 2008 en verwachting voor 2009)
Franstalige
databases:
http://www.bdpv.fr/stat_departement.php (zeer
interessante, reeds ruim 4.000 PV-systemen [15,212 MWp] bevattende
particuliere database met als zwaartepunt Frankrijk [24 sep. 2009:
3.567 installaties], maar ook veel Belgische systemen: 480 stuks in
Franstalig België, 27 installaties in het autonome Bruxelles,
en ook nog 19 exemplaren in drie Vlaamse provincies, ook klikbare
kaart met alle installaties)
http://www.ef4.be/fr/getMOD/v/vID/425/modEND/pv-database/pv-database.html (Franstalige
database voor Wallonië en Brussel met [stand 22 sep. 2009] reeds
2.126 aangemelde, vaak enkele kWac grote particuliere installaties,
niet officieel)
Webpagina voor het eerst opgemaakt dd. 22 september 2009, daarna indien mogelijk updates zodra nieuwe data bekend worden gemaakt
updates:
7 oktober 2009; 24 december 2009; 2 februari 2010; 7 februari 2010 (volledige
update rest van België); 11 februari 2010 (herziene update voor
heel België/gewijzigde data voor Vlaanderen); 11 maart 2010
(update Vlaanderen tm. feb. 2010); 1 april 2010 (publicatie samenvatting
van deze pagina op SolarPlaza.com); 5 mei 2010 (update Vlaanderen
tm. apr. 2010); 15 juni 2010 (update Vlaanderen tm. mei 2010); 12 juli
2010 (update Vlaanderen tm. 29 juni 2010); 8 augustus 2010 (update
Vlaanderen tm. 31 juli 2010, foto's Katoen Natie); 13 december 2010
(update Vl., foto Diepenbeek sluis); 23 januari 2011 (update Vlaanderen
tm. 1 januari 2011); 31 maart 2011 (volledige update tm. 28 februari
2011 met enkele nieuwe grafieken, aanpassing alle VREG data: opgaves
in AC vermogen); 27 april 2011 (update 5 apr. 2011, markt groei tabel
2011, foto Nyrstar project, en 2e grafiek Katoen Natie toegevoegd).
|